Reliability in psychology research refers to the reproducibility or consistency of measurements. Specifically, it is the degree to which a measurement instrument or procedure yields the same results on repeated trials. A measure is considered reliable if it produces consistent scores across different instances when the underlying thing being measured has not changed.
Reliability ensures that responses are consistent across times and occasions for instruments like questionnaires. Multiple forms of reliability exist, including test-retest, inter-rater, and internal consistency.
For example, people who weigh themselves expect a similar reading each time. A scale that gave a different weight every time, or a tape measure that read a different length on repeat use, would not be reliable.
Consistently replicated findings are reliable. Researchers typically use a correlation coefficient to assess this, since a reliable test shows a high positive correlation between repeated results.
Because participants and situations vary, scores rarely match exactly. Still, a strong positive correlation between repeated results indicates good reliability.
Reliability matters because unreliable measures introduce random error. This error attenuates correlations, making real relationships harder to detect.
High reliability also boosts a study’s sensitivity, validity, and replicability, which is why researchers treat reporting reliability evidence as standard practice.
There are two types of reliability: internal and external.
- Internal reliability refers to how consistently different items within a single test measure the same concept or construct. It ensures that a test is stable across its components.
- External reliability measures how consistently a test produces similar results over repeated administrations or under different conditions. It ensures that a test is stable over time and situations.

Some key aspects of reliability in psychology research include:
- Test-retest reliability: The consistency of scores for the same person across two or more separate administrations of the same measurement procedure over time. High test-retest reliability suggests the measure provides a stable, reproducible score.
- Interrater reliability: The level of agreement in scores on a measure between different raters or observers rating the same target. High interrater reliability suggests the ratings are objective and not overly influenced by rater subjectivity or bias.
- Internal consistency reliability: The degree to which different test items or parts of an instrument that measure the same construct yield similar results. Analyzed statistically using Cronbach’s alpha, a high value suggests the items measure the same underlying concept.
Test-Retest Reliability
The test-retest method assesses the external consistency of a test. Examples of appropriate tests include questionnaires and psychometric tests. It measures the stability of a test over time.
A typical assessment would involve giving participants the same test on two separate occasions. If the same or similar results are obtained, then external reliability is established.
Here’s how it works:
- A test or measurement is administered to participants at one point in time.
- After a certain period, the same test is administered again to the same participants without any intervention or treatment in between.
- The scores from the two administrations are then correlated using a statistical method, often Pearson’s correlation.
- A high correlation between the scores from the two test administrations indicates good test-retest reliability, suggesting the test yields consistent results over time.
This method is especially useful for tests that measure stable traits or characteristics that aren’t expected to change over short periods.
The disadvantage of the test-retest method is that it takes a long time for results to be obtained. The reliability can be influenced by the time interval between tests and any events that might affect participants’ responses during this interval.
Beck et al. (1996) tested 26 outpatients on the Beck Depression Inventory-II twice, one week apart. The two sets of scores correlated at r = .93, demonstrating high test-retest reliability for the depression inventory.
This shows why reliability matters in psychological research. Without reliable tests, clinicians risk missing a diagnosis like depression, so patients may not receive the therapy they need.
Timing matters: too short an interval and participants may recall their earlier answers, artificially inflating the correlation. Too long an interval, and genuine change in the trait being measured is confounded with test inconsistency, which can bias results just as much (Guttman, 1945).
Inter-Rater Reliability
Inter-rater reliability, often termed inter-observer reliability, refers to the extent to which different raters or evaluators agree in assessing a particular phenomenon, behavior, or characteristic.
High inter-rater reliability indicates that the findings or measurements are consistent across different raters, suggesting the results are not due to random chance or subjective biases of individual raters.
The choice between them depends on the data type.
Statistical measures such as Cohen’s Kappa or the Intraclass Correlation Coefficient (ICC) are often used to quantify agreement between raters. ICC plays the same role as kappa for continuous ratings (LeBreton & Senter, 2008), helping to ensure that findings are objective and reproducible.
Landmark Study: Cohen’s Kappa
Aim: Cohen (1960) wanted a way to measure agreement between two raters that corrects for chance. Raw percentage agreement is inflated whenever raters tend to use the same category often.
Method: For two raters sorting cases into categories, Cohen defined kappa as observed agreement minus chance agreement. This difference is then divided by the maximum possible agreement beyond chance.
Kappa corrects for that overlap.
Results: A kappa of 1 means perfect agreement, and a kappa of 0 means the raters agree no better than chance would predict. Kappa can even turn negative when two raters disagree more than chance alone would produce.
Negative values are rare.
Conclusion: Cohen’s kappa is now the standard chance-corrected agreement statistic across psychology and medicine, from behavioral coding to diagnostic interviews. Landis and Koch’s (1977) benchmarks are widely used to interpret it, though even “substantial” agreement can be too low for some clinical decisions.
This matters most in subjective judgment tasks. Confidence that findings are replicable depends on ruling out individual rater bias.
In observational research, researchers observe the same behavior independently to avoid bias, then compare their data; similar data supports reliability.
Where observer scores do not significantly correlate, then reliability can be improved by:
- Train observers in the observation techniques and ensure everyone agrees on them.
- Operationalize behavior categories so they are objectively defined.
For example, if two researchers are observing ‘aggressive behavior’ of children at nursery they would both have their own subjective opinion regarding what aggression comprises.
In this scenario, they would be unlikely to record aggressive behavior the same, and the data would be unreliable.
However, operationalizing the behavior category of aggression makes it more objective. It becomes easier to identify when a specific behavior occurs.
For example, while “aggressive behavior” is subjective and not operationalized, “pushing” is objective and operationalized. Thus, researchers could count how many times children push each other over a certain duration of time.
Internal Consistency Reliability
Internal consistency reliability refers to how well different items on a test or survey that are intended to measure the same construct produce similar scores.
For example, a questionnaire measuring depression may have multiple questions tapping issues like sadness, changes in sleep and appetite, fatigue, and loss of interest. The assumption is that people’s responses across these different symptom items should be fairly consistent.
Cronbach’s alpha is a common statistic used to quantify internal consistency reliability. It calculates the average inter-item correlations among the test items.
Values range from 0 to 1, with higher values indicating greater internal consistency. A good rule of thumb is that alpha should generally be above .70 to suggest adequate reliability.
Landmark Study: Cronbach’s Alpha
Aim: Cronbach (1951) wanted one coefficient to estimate a scale’s internal consistency directly from its item correlations. Earlier methods only worked for right/wrong (dichotomous) items.
Method: Cronbach calculated alpha from the number of items, their individual variances, and the total test variance. He then showed, algebraically, that alpha equals the average of every possible split-half reliability coefficient (the correlation between two half-tests) for that test.
Findings: Alpha rises with more items and with a higher average correlation between them.
Higher alpha is not always better.
It is technically a lower bound on reliability, not an exact value, and it assumes every item measures the underlying trait equally strongly.
Conclusion: Coefficient alpha has been the default internal-consistency statistic for over 70 years. It appears in the manual of nearly every published personality inventory and clinical scale.
Sijtsma later disagreed.
Sijtsma (2009) later warned that alpha is widely misused as proof of a scale’s quality. A high alpha does not show that a scale measures only one thing. A set of items covering several different concepts can still produce an alpha above .90 if there are enough of them.
Alpha alone cannot show this.
Sijtsma argued researchers should report alpha alongside a factor analysis of the scale’s structure. He also recommended newer statistics, such as McDonald’s omega, when alpha’s assumptions do not hold.
An alpha of .90 for a depression questionnaire, for example, means respondents’ scores correlate highly across the different symptom items, all measuring depression consistently.
Low alpha tells a different story.
If some items were unrelated to the others, the average inter-item correlation would drop, producing a lower alpha. That would point to multiple dimensions rather than one unified construct.
Split-Half Method
The split-half method assesses the internal consistency of a test, such as psychometric tests and questionnaires. It takes advantage of the natural variation when a single test is divided in half.
It’s somewhat cumbersome to implement but avoids limitations associated with Cronbach’s alpha. Alpha remains much more widely used in practice due to its relative ease of calculation.
Here’s how it works:
- A test or questionnaire is split into two halves, typically by separating even-numbered items from odd-numbered items, or first-half items vs. second-half.
- Each half is scored separately, and the scores are correlated using a statistical method, often Pearson’s correlation.
- The correlation between the two halves gives an indication of the test’s reliability. A higher correlation suggests better reliability.
- The Spearman-Brown prophecy formula is then applied to estimate the reliability of the full test from the split-half reliability, correcting for the shortened length of each half.
The reliability of a test could be improved by using this method. Items on separate halves with a low correlation (e.g., r = .25) should be removed or rewritten.
The split-half method is a quick and easy way to establish reliability. However, it can only be effective with large questionnaires in which all questions measure the same construct. This means it would not be appropriate for tests that measure different constructs.
For example, the Minnesota Multiphasic Personality Inventory has subscales measuring different behaviors, such as depression, schizophrenia, and social introversion. The split-half method would not be an appropriate way to assess reliability for this personality test.
Parallel-Forms Reliability
Parallel-forms reliability compares two different versions of the same test, such as two IQ-test forms with different questions but matched difficulty. It correlates people’s scores on both versions.
A high correlation supports the idea that the underlying construct, not the specific wording of the items, is driving the score.
This method is especially useful when practice or memory effects would inflate a test-retest correlation. Cognitive testing with only a short gap between sessions is a good example.
Validity vs. Reliability In Psychology
In psychology, validity and reliability are fundamental concepts that assess the quality of measurements.
- Validity: The degree to which a measure accurately assesses the specific concept, trait, or construct it claims to assess.
- Reliability: The overall consistency, stability, and repeatability of a measurement, i.e. how much random error or noise is distorting scores.
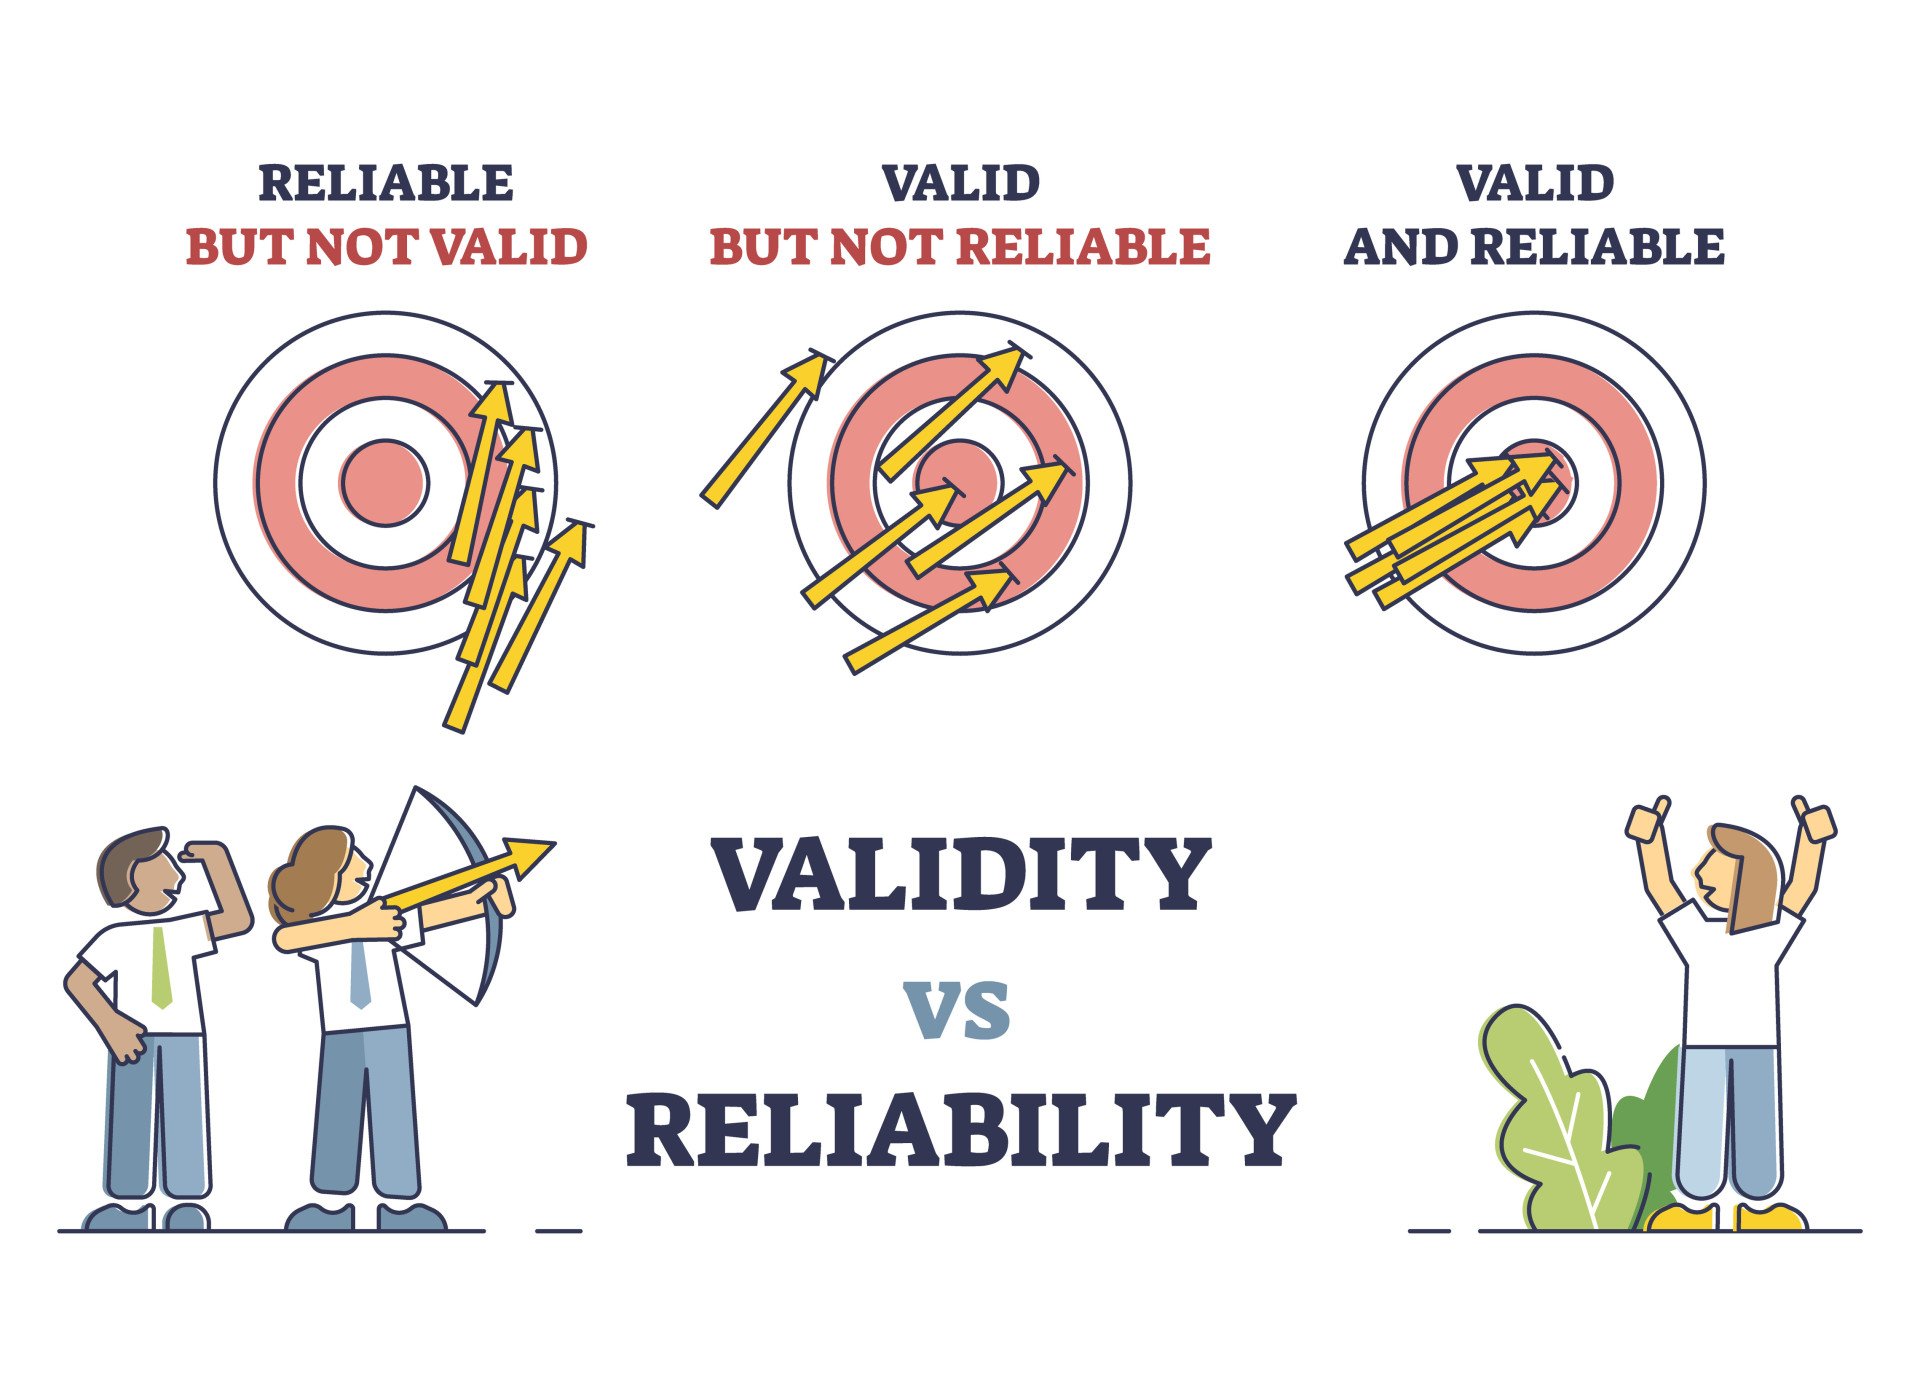
A key difference is that validity refers to what’s being measured, while reliability refers to how consistently it’s being measured.
An unreliable measure cannot be truly valid. If a measure gives inconsistent, unpredictable scores, it isn’t measuring the trait or quality it aims to measure in a truthful, systematic manner. Establishing reliability provides the foundation for determining the measure’s validity.
A pivotal understanding is that reliability is a necessary but not sufficient condition for validity.
This isn’t just a rule of thumb: it’s mathematical (Spearman, 1904). Reliability sets a hard ceiling on validity. The correlation between any two measures can never exceed the square root of the product of their two reliabilities.
For example, a depression scale with reliability .81 and a clinical rating with reliability .64 can correlate at most about .72. That’s true no matter how well the scale actually captures depression.
The reverse is not true. Improving reliability raises the ceiling on validity; poor reliability locks it out.
It means a test can be reliable, consistently producing the same results, without being valid, or accurately measuring the intended attribute. This is the classic reliability-validity trade-off (Clifton, 2020).
However, a valid test, one that truly measures what it purports to, must be reliable. In the pursuit of rigorous psychological research, both validity and reliability are indispensable.
Ideally, researchers strive for high scores on both. Validity confirms they are measuring the correct construct, while reliability confirms they are measuring it accurately and precisely. The two qualities are distinct but both crucial to strong measurement procedures.
Critical Evaluation
Reliability statistics like Cronbach’s alpha, Cohen’s kappa, and test-retest correlations give psychology a shared, comparable language for judging measurement quality.
Reliability, like validity, is not a one-time certificate. A measure’s reliability must be re-established whenever the sample, setting, or purpose changes. A scale reliable for one group is not guaranteed to be reliable for another.
A high reliability score is not the end of the story. It says nothing about validity, and recent research shows some textbook-reliable tasks behave very differently once individual scores become the target.
Contemporary Research
Aim: Hedge, Powell and Sumner (2018) tested whether classic cognitive tasks that reliably produce strong group-level effects also provide reliable individual scores.
Method: Across seven tasks, including the Stroop, flanker and Posner cueing paradigms, participants completed each task twice, three weeks apart. The researchers calculated test-retest reliability for individual scores alongside the usual group-level effect size.
This let the team compare both kinds of reliability directly.
Results: Group-level effects were large and consistent: Stroop interference reached an effect size of around d = 1.5. But test-retest reliability for individual differences was often poor, with many intraclass correlations below .5.
The pattern held across tasks.
Conclusion: A robust group effect does not guarantee a reliable individual score. The tasks are designed to minimise differences between people, which produces a clean group effect but destroys the very variance a reliable individual measure needs.
The paradox has real consequences.
Loken and Gelman (2017) added a further twist: unreliable measures do not just weaken true effects, as classical test theory predicts. Combined with selective reporting of significant results, measurement error can make published effect sizes look systematically larger than they really are.
Researchers are now redesigning classic tasks to fix this gap. Techniques like drift diffusion modelling, hierarchical Bayesian scoring, and longer testing sessions aim to recover reliable individual scores. The goal is keeping the robust group-level effect that made these tasks popular in the first place.
This distinction matters outside the lab, too. A clinical or forensic tool needs a kind of reliability a research task can do without.
It must give consistent scores for one person, not just a robust average across a group. A screening measure with a strong group effect in a validation study is not automatically fit for diagnosing, or comparing, individuals.
Key Takeaways
- Reliability Means Consistency: A measure is reliable when it produces the same result across repeated trials, occasions, or raters, not necessarily when it measures the right thing.
- Test-Retest Reliability: The same test given twice to the same people should correlate highly; Beck et al.’s (1996) Beck Depression Inventory-II study found r = .93 after a one-week gap.
- Inter-Rater Reliability: Independent raters should agree; Cohen’s kappa corrects raw agreement for chance and is the standard statistic reported across psychology and medicine.
- Internal Consistency: Cronbach’s alpha estimates how well a scale’s items hang together, but statisticians now treat it only as a lower-bound estimate, not proof a scale measures one thing.
- Reliability Caps Validity: A test’s maximum possible validity is mathematically limited by its reliability, so improving reliability always raises the ceiling on validity.
- The Reliability Paradox: Some of psychology’s most robust experimental tasks, like the Stroop test, produce reliable group effects but unreliable individual scores.
- Not the Whole Story: Reliability is necessary but not sufficient for validity; a perfectly consistent measure can still be consistently wrong.
References
Beck, A. T., Steer, R. A., & Brown, G. K. (1996). Manual for the Beck Depression Inventory-II. San Antonio, TX: The Psychological Corporation.
Clifton, J. D. W. (2020). Managing validity versus reliability trade-offs in scale-building decisions. Psychological Methods, 25(3), 259–270. https://doi.org/10.1037/met0000236
Cohen, J. (1960). A coefficient of agreement for nominal scales. Educational and Psychological Measurement, 20(1), 37–46. https://doi.org/10.1177/001316446002000104
Cronbach, L. J. (1951). Coefficient alpha and the internal structure of tests. Psychometrika, 16(3), 297–334. https://doi.org/10.1007/BF02310555
Guttman, L. (1945). A basis for analyzing test-retest reliability. Psychometrika, 10(4), 255–282. https://doi.org/10.1007/BF02288892
Hathaway, S. R., & McKinley, J. C. (1943). Manual for the Minnesota Multiphasic Personality Inventory. New York: Psychological Corporation.
Hedge, C., Powell, G., & Sumner, P. (2018). The reliability paradox: Why robust cognitive tasks do not produce reliable individual differences. Behavior Research Methods, 50(3), 1166–1186. https://doi.org/10.3758/s13428-017-0935-1
Jannarone, R. J., Macera, C. A., & Garrison, C. Z. (1987). Evaluating interrater agreement through “case-control” sampling. Biometrics, 43(2), 433–437. https://doi.org/10.2307/2531825
Landis, J. R., & Koch, G. G. (1977). The measurement of observer agreement for categorical data. Biometrics, 33(1), 159–174. https://doi.org/10.2307/2529310
LeBreton, J. M., & Senter, J. L. (2008). Answers to 20 questions about interrater reliability and interrater agreement. Organizational Research Methods, 11(4), 815–852. https://doi.org/10.1177/1094428106296642
Loken, E., & Gelman, A. (2017). Measurement error and the replication crisis. Science, 355(6325), 584–585. https://doi.org/10.1126/science.aal3618
Sijtsma, K. (2009). On the use, the misuse, and the very limited usefulness of Cronbach’s alpha. Psychometrika, 74(1), 107–120. https://doi.org/10.1007/s11336-008-9101-0
Spearman, C. (1904). The proof and measurement of association between two things. American Journal of Psychology, 15(1), 72–101. https://doi.org/10.2307/1412159
Watkins, M. W., & Pacheco, M. (2000). Interobserver agreement in behavioral research: Importance and calculation. Journal of Behavioral Education, 10, 205–212