Sampling bias occurs when a sample does not accurately represent the population being studied. This can happen when there are systematic errors in the sampling process, leading to over-representation or under-representation of certain groups within the sample.
Some members of the population were more likely to be selected than others. This directly threatens a study’s external validity.
Findings from a biased sample can only be generalized to people who share its characteristics, not to the wider population. The bias is systematic, not random chance.
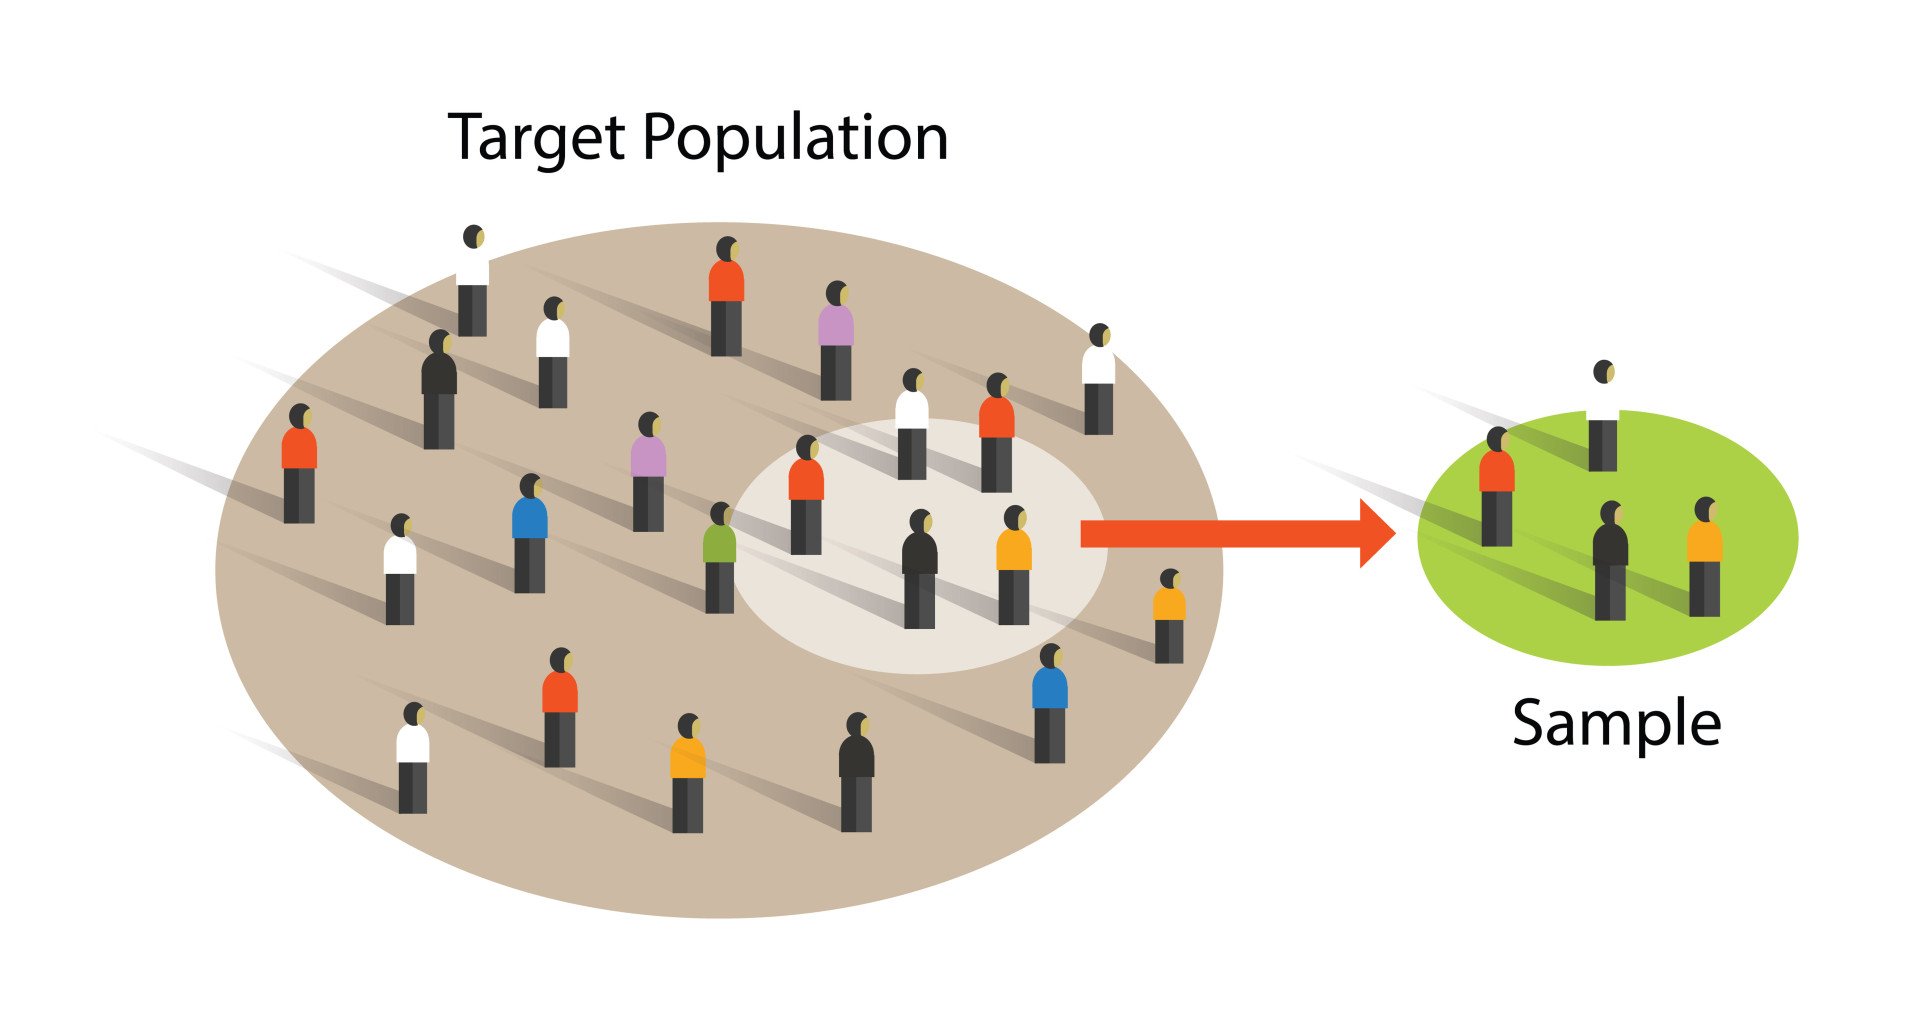
In medical research, this same pattern is called ascertainment bias, where one group of participants is over-represented in the sample. Excluding parts of the population this way misleads the results and discards valuable data that the study needed.
Sampling bias arises in the selection and recruitment method, even though it shows up in the achieved sample. It often happens without the researcher’s knowledge.
Key Takeaways
- Definition: Sampling bias is a systematic difference between who is included in a sample and who is excluded, so some groups are over- or under-represented.
- Not Random: Unlike ordinary sampling error, bias pushes results in one direction and does not shrink as the sample grows.
- Common Causes: Sampling bias often comes from convenience-based selection, a sampling frame that does not match the target population, or non-response.
- WEIRD Samples: Much of psychology’s evidence comes from Western, Educated, Industrialized, Rich and Democratic samples, which are frequent outliers on many measures (Henrich et al., 2010).
- Size Isn’t Enough: A larger sample does not fix a biased sampling method; a huge but poorly sampled study can still be precisely wrong.
- Fixes: Use random or stratified sampling, clearly define the target population and sampling frame, and follow up on non-responders.
Examples of Sampling Bias
Imagine you want to study the prevalence of depression amongst undergraduate students at your university. You send out an email to the whole student body asking for volunteers.
This method leads to sampling bias, because only students who are comfortable discussing their depression will sign up.
It is an example of voluntary response bias. Only people willing to talk about their experiences take part, so the sample is not representative.
Other common examples include:
- Late arrivals: Surveying students at the start of a lecture misses those who arrive late. The sample is biased if late arrivers differ systematically from early ones.
- Newspaper adverts: Recruiting volunteers through a New York Times advert limits generalization, because its readers may not represent the wider population politically or socio-economically.
- Self-selected quizzes: Hazan and Shaver (1987) invited newspaper readers to mail in answers to a “Love Quiz.” Readers moved to respond may not represent people in general.
- Landline-only surveys: A telephone survey misses households without a landline, so those people can never be selected. This is undercoverage.
- Literary Digest poll (1936): A huge mailed poll left out poorer voters and called the election wrong, as explained below.
Types of Sampling Bias
The article covers seven types of bias, each explained in its own section below:
- Undercoverage: part of the population has little or no chance of being selected.
- Voluntary response: people choose whether to take part, so participants differ from non-participants.
- Survivorship: only the individuals or groups that passed a selection process are studied.
- Non-response: people who refuse or drop out differ from those who stay.
- Recall: participants remember details inaccurately, which distorts their reports.
- Exclusion: a particular group is deliberately left out of the sample.
- Observer: observers see what they expect or want to see.
Undercoverage Bias
Undercoverage bias occurs when some population members are inadequately represented in the sample, so they have less chance of being selected than others.
For example, administering a survey online will exclude groups with limited internet access, such as the elderly and those in lower-income households.
Results are only biased if the excluded group differs in some meaningful way from those included, not simply because a group was missed.
Voluntary Response Bias / Self-Selection Bias
Self-selection bias is a type of bias that occurs when participants can choose whether or not to participate in the project.
Bias arises because people with specific characteristics might be more likely to agree to participate in a study than others, making the participants a non-representative sample.
For example, people with strong opinions or substantial knowledge about a specific topic may be more willing to spend time answering a survey than those without.
Volunteers also tend to differ from non-volunteers in predictable ways. Rosenthal and Rosnow’s (1975) analysis found that, compared with people who do not come forward, volunteers are on average:
- Better educated
- More sociable
- More approval-seeking
In health research this pattern has its own name: the healthy-volunteer effect.
People who volunteer for health studies tend to be healthier and more health-conscious than the population the study is meant to represent. This makes treatments look better than they are.
Survivorship Bias
Survivorship bias refers to when researchers focus on individuals, groups, or observations that have passed some sort of selection process while ignoring those who did not.
In other words, only “surviving” subjects are selected. For example, in finance, failed companies tend to be excluded from performance studies because they no longer exist.
This causes the results to skew higher because only companies that were successful enough to survive are included.
Non-Response Bias
Non-response bias is a type of bias that arises when people who refuse to participate or drop out of a study systematically differ from those who take part.
For example, imagine a study on the prevalence of depression in a community. If people with depression are less likely to take part than those without it, the results will underestimate how common depression really is.
Recall Bias
Recall bias occurs when some members of your sample cannot remember important details accurately. As a result, they might provide incomplete or incorrect information that can distort your research findings.
This type of bias tends to affect retrospective surveys that rely on self-reported data. Strictly, it distorts what participants report, not who is selected.
That makes it a form of non-sampling error: a mistake unrelated to the act of selection, which can affect even a complete census.
Exclusion Bias
This bias results from intentionally excluding a particular group from the sample. Exclusion bias is closely related to non-response bias and undercoverage.
Like both, it distorts results only when the excluded group differs from the included group in ways that matter to the research question.
The difference is that here the omission is a deliberate choice, rather than a gap in the sampling frame or a refusal to take part.
Observer Bias
Observer bias refers to the tendency of observers not to see what is there, but instead to see what they expect or want to see.
This bias can result in an overestimation or underestimation of what is true and accurate, which compromises the validity of your research findings. It distorts measurement, not selection. That makes it non-sampling error.
For example, researchers might unintentionally influence participants during interviews by focusing on specific statistics that tend to support the hypothesis instead of those that do not.
Causes of Sampling Bias
A common cause of sampling bias lies in the study’s design or data collection, where researchers may favor or disfavor certain people or conditions.
Bias also creeps in when researchers rely on judgment or convenience rather than a properly randomized strategy.
This can happen in both probability and non-probability sampling.
Each sampling method has its own typical route to bias:
| Sampling method | Type | Main route to bias |
|---|---|---|
| Simple random | Probability | Needs a complete list, and refusals reintroduce bias |
| Systematic | Probability | A hidden pattern in the list that matches the interval skews the sample |
| Stratified | Probability | Needs the population’s true proportions in advance |
| Cluster | Probability | Chosen clusters may be atypical, which raises sampling error |
| Convenience | Non-probability | Easy-to-reach people can differ from the wider population |
| Volunteer | Non-probability | Volunteers differ from non-volunteers |
| Quota | Non-probability | Interviewers choose who fills each quota, which can add their own bias |
| Purposive | Non-probability | The researcher’s judgment decides who counts as appropriate |
| Snowball | Non-probability | People recruit others like themselves, so the sample is homogeneous |
Causes in Probability Sampling
In probability sampling, every member of the population has a known, non-zero chance of being selected, though not always an equal one. This reduces the risk of sampling bias but does not eliminate it.
Extracting random samples typically requires a sampling frame: a list of the population from which the sample is drawn. A sampling frame does not by itself prevent sampling bias.
A mismatched frame biases the sample. This can happen when a researcher fails to correctly determine the target population, the whole group the study is about. An outdated or incomplete frame excludes parts of it.
Even a properly selected frame can still produce a biased sample through non-response, if certain kinds of people are more likely to refuse to take part.
Mismatches between the sampling frame and the target population, together with non-response, are the main routes to a biased sample in probability sampling.
Causes in Non-Probability Sampling
In non-probability sampling, samples are selected using non-random criteria, such as convenience sampling, where participants are chosen based on accessibility or availability rather than a random process.
These sampling techniques often produce biased samples, because some population members are more or less likely to be included than others.
Because the chance of being selected is unknown and often uneven, statistical generalisation to the wider population is far less secure than with probability sampling.
This trade-off keeps them cheap, but riskier to generalise from.
How to Avoid Sampling Bias
- Use random or stratified sampling → Stratified random sampling helps ensure a representative sample and reduces interference from irrelevant variables.
- Avoid convenience sampling → Rather than collecting data from only easily accessible or available participants, you should gather data from the different subgroups that make up your population of interest.
- Clearly define a target population and a sampling frame → Matching the sampling frame to the target population as much as possible will reduce the risk of sampling bias.
- Follow up on non-responders → Contact people who drop out or fail to respond to find out why, and see whether you can secure a response. Keep in regular touch with participants to reduce attrition.
- Oversampling → Oversampling can be used to avoid sampling bias in cases where members of the defined population are underrepresented.
- Aim for a large, well-sampled study → A bigger sample captures more subgroups, but size alone cannot fix a biased sampling method; it must be paired with representative selection.
- Pre-register your sampling plan → Fix the target sample size, stopping rules and inclusion criteria before collecting data, so decisions are not made after seeing the results (Nosek et al., 2018).
- Set up quotas for each identified demographic → If a characteristic such as gender, age or ethnicity could bias your study, quotas let you sample each group in proportion to the population. Selection within quotas is non-random, so interviewer bias remains possible.
Critical Evaluation of Sampling Bias Research
Sampling bias is not just a technical flaw to correct case by case.
It shapes what psychology as a whole can credibly claim about human behaviour, in ways that go well beyond any single study. It also explains why fixing one study’s sample does not fix the field’s evidence base.
The WEIRD Samples Problem
Henrich, Heine and Norenzayan (2010) found that most published psychology findings come from Western, Educated, Industrialized, Rich and Democratic (WEIRD) populations, with American undergraduates hugely over-represented.
On measures ranging from visual perception to fairness and moral reasoning, these participants are frequent outliers rather than a neutral human default.
Arnett (2008) made a related point. Top psychology journals drew most of their samples from the United States, leaving what he called the ‘neglected 95%’ of the world.
A decade later, Thalmayer, Toscanelli and Arnett (2021) reanalyzed the same six journals for 2014 to 2018. Samples and authors were now a little over 60% American, down from over 70% a decade earlier. Majority-world samples remained scarce: 4 to 5% of the total.
Sears (1986) had earlier warned that social psychology’s heavy reliance on the college sophomore in the laboratory gives a distorted, age- and cohort-bound picture of human nature.
The same skew appears in research on children. Nielsen et al. (2017) showed that high-impact developmental journals are heavily skewed toward WEIRD populations. They also reported a habitual reliance on convenience sampling and little sign of change.
Convenience sampling is not a minor shortcut here. It is a systematic threat to how far psychology’s findings can generalise.
Do WEIRD Samples Change the Results?
Many Labs 2 (Klein et al., 2018) tested how far effects depend on who is sampled.
- Aim: To examine how much the size of 28 published psychological effects varies across samples and settings.
- Method: Preregistered replications of 28 classic and contemporary findings ran in 125 samples. Together they included 15,305 participants from 36 countries and territories.
- Results: Fifteen of 28 replications (54%) found a significant effect in the original direction. Median effect sizes fell from d = 0.60 to d = 0.15, and exploratory comparisons found little difference between WEIRD and less WEIRD cultures.
- Conclusion: Variation in effect sizes depended more on the effect studied than on the sample or setting.
This tempers the WEIRD critique rather than dismissing it. The direction and size of sampling bias are usually unknown, so representativeness still has to be engineered at the sampling stage.
Why a Large Sample Doesn’t Guarantee an Unbiased One
Size is often mistaken for representativeness, but a large sample gathered by a biased method is simply a precisely wrong estimate.
The clearest historical demonstration is the Literary Digest poll ahead of the 1936 US presidential election.
One case makes this vivid. The magazine mailed about ten million straw-vote ballots, drawn from its own subscriber list and from car-registration, telephone and club-membership lists.
From the roughly 2.3 million ballots returned, it confidently predicted a landslide win for the Republican Alf Landon.
He lost by a landslide.
The sampling frame had silently excluded poorer, disproportionately Democratic voters who, in the Depression, owned neither a car nor a telephone. The low return rate added non-response bias on top of this frame error.
In the same election, George Gallup correctly called the result from a far smaller quota sample of around thirty thousand people.
The Replication Crisis
The Open Science Collaboration (2015) attempted to replicate 100 psychology studies and reproduced fewer than half of the original effects. Narrow, convenience-based samples are one suspected contributor, though not the only one.
- Aim: To estimate the reproducibility of psychological science by directly replicating 100 studies from three leading journals.
- Method: For each original study, an independent team ran one replication using the original methods and materials as closely as possible. Effect sizes and significance were then compared.
- Results: Of the original studies, 97% reported significant effects, but only 36% of replications did. Mean replication effect sizes were roughly half the original size.
- Conclusion: Reproducibility is lower than the published literature implies. Small, convenience-based and underpowered samples are one suspected contributor, alongside publication bias.
Unrepresentative sampling is therefore one reason findings fail to generalise across people and contexts. Sampling is not a peripheral detail. It is part of the field’s credibility problem.
Contemporary Research
Much data collection has moved to online labour markets such as Amazon Mechanical Turk and Prolific, which give faster, cheaper access to more varied samples than the campus subject pool.
Buhrmester, Kwang and Gosling (2011) tested this directly and found MTurk data was at least as reliable as data collected through traditional methods.
These are still convenience samples, with their own biases.
Paolacci and Chandler (2014) found crowdworkers are non-representative in age, income and attitudes, and often ‘non-naïve’: experienced workers have seen common experimental manipulations many times before, which can distort results.
The bias just moves online.
Peer et al. (2017) compared platforms directly and found meaningful differences in attention and data quality between MTurk and alternatives such as Prolific.
A related reform is pre-registration.
It means publicly stating a study’s design, hypotheses and analysis plan before data collection begins. Simmons, Nelson and Simonsohn (2011) showed that flexibility in when to stop collecting data inflates false-positive rates.
Pre-registration now typically fixes the sampling plan in advance, including a target sample size and stopping rules.
That shift is still underway.
Nosek et al. (2018) describe this as a shift toward transparent, confirmatory research rather than decisions made after seeing the data.
FAQs
What is the difference between sampling bias and sampling error?
Sampling error is the natural, random difference between a sample statistic and the true population value. It happens even with a perfectly unbiased sample and shrinks as the sample grows.
Sampling bias is different: it is a systematic distortion that does not wash out with a larger sample.
What is the difference between sampling bias and response bias?
Sampling bias occurs when some members of a population are systematically more likely to be selected in a sample than others. As a result, the sample misrepresents the group.
Response bias is a general term that refers to a wide range of conditions or factors that can lead participants to respond inaccurately or falsely to questions.
For example, there could be something about how the actual survey questionnaire is constructed that encourages a certain type of answer, leading to measurement error.
Which type of sampling is most at risk for sampling bias?
Non-probability sampling, specifically convenience sampling, is most at risk for sampling bias. With this type of sampling, some members of the population are more likely to be included than others.
Does sampling bias affect reliability?
Sampling bias mainly threatens external validity, not reliability. A study can still be reliable, meaning it gives consistent results, even when its sample is biased.
What a biased sample undermines is generalizability: findings may not extend beyond people like those actually sampled.
Why is it important to avoid sampling bias in research?
It is important to avoid sampling bias in research because otherwise, the population of interest will not be accurately represented. If the sample bias is not addressed then, your research loses its credibility.
Is probability sampling biased?
Probability sampling can significantly reduce sampling bias by giving every member of the population an equal chance of being included in the research.
This method can still result in a biased sample if your sampling frame does not match the population of interest.
Can sampling error be calculated?
Yes, under probability sampling it can be quantified. The standard error is the standard deviation of the population divided by the square root of the sample size. Multiplying it by the z-score for your confidence level (1.96 for 95%) gives the margin of error.
Formula: margin of error = z-score × [standard deviation of population / (square root of sample size)]
References
Arnett, J. J. (2008). The neglected 95%: Why American psychology needs to become less American. American Psychologist, 63(7), 602–614. https://doi.org/10.1037/0003-066X.63.7.602
Buhrmester, M., Kwang, T., & Gosling, S. D. (2011). Amazon’s Mechanical Turk: A new source of inexpensive, yet high-quality, data? Perspectives on Psychological Science, 6(1), 3–5. https://doi.org/10.1177/1745691610393980
Hamill, R., Wilson, T. D., & Nisbett, R. E. (1980). Insensitivity to sample bias: Generalizing from atypical cases. Journal of Personality and Social Psychology, 39(4), 578–589. https://doi.org/10.1037/0022-3514.39.4.578
Hazan, C., & Shaver, P. R. (1987). Romantic love conceptualized as an attachment process. Journal of Personality and Social Psychology, 52(3), 511–524. https://doi.org/10.1037/0022-3514.52.3.511
Henrich, J., Heine, S. J., & Norenzayan, A. (2010). The weirdest people in the world? Behavioral and Brain Sciences, 33(2–3), 61–83. https://doi.org/10.1017/S0140525X0999152X
Klein, R. A., Vianello, M., Hasselman, F., Adams, B. G., Adams, R. B., Alper, S., Aveyard, M., Axt, J. R., Babalola, M. T., Bahník, Š., Batra, R., Berkics, M., Bernstein, M. J., Berry, D. R., Bialobrzeska, O., Binan, E. D., Bocian, K., Brandt, M. J., Busching, R., . . . Nosek, B. A. (2018). Many Labs 2: Investigating variation in replicability across samples and settings. Advances in Methods and Practices in Psychological Science, 1(4), 443–490. https://doi.org/10.1177/2515245918810225
Nielsen, M., Haun, D., Kärtner, J., & Legare, C. H. (2017). The persistent sampling bias in developmental psychology: A call to action. Journal of Experimental Child Psychology, 162, 31–38. https://doi.org/10.1016/j.jecp.2017.04.017
Nosek, B. A., Ebersole, C. R., DeHaven, A. C., & Mellor, D. T. (2018). The preregistration revolution. Proceedings of the National Academy of Sciences, 115(11), 2600–2606. https://doi.org/10.1073/pnas.1708274114
Open Science Collaboration. (2015). Estimating the reproducibility of psychological science. Science, 349(6251), aac4716. https://doi.org/10.1126/science.aac4716
Paolacci, G., & Chandler, J. (2014). Inside the Turk: Understanding Mechanical Turk as a participant pool. Current Directions in Psychological Science, 23(3), 184–188. https://doi.org/10.1177/0963721414531598
Peer, E., Brandimarte, L., Samat, S., & Acquisti, A. (2017). Beyond the Turk: Alternative platforms for crowdsourcing behavioral research. Journal of Experimental Social Psychology, 70, 153–163. https://doi.org/10.1016/j.jesp.2017.01.006
Rosenthal, R., & Rosnow, R. L. (1975). The volunteer subject. Wiley.
Sears, D. O. (1986). College sophomores in the laboratory: Influences of a narrow data base on social psychology’s view of human nature. Journal of Personality and Social Psychology, 51(3), 515–530. https://doi.org/10.1037/0022-3514.51.3.515
Simmons, J. P., Nelson, L. D., & Simonsohn, U. (2011). False-positive psychology: Undisclosed flexibility in data collection and analysis allows presenting anything as significant. Psychological Science, 22(11), 1359–1366. https://doi.org/10.1177/0956797611417632
Thalmayer, A. G., Toscanelli, C., & Arnett, J. J. (2021). The neglected 95% revisited: Is American psychology becoming less American? American Psychologist, 76(1), 116–129. https://doi.org/10.1037/amp0000622