A statistically significant result cannot prove that a research hypothesis is correct (which implies 100% certainty).
Because a p -value is based on probabilities, there is always a chance of making an incorrect conclusion regarding accepting or rejecting the null hypothesis ( H0).
Key Takeaways
- Type I error: A false positive: rejecting a true null hypothesis. Its rate, alpha, is set by the researcher before data collection (conventionally .05).
- Type II error: A false negative: failing to reject a false null hypothesis. Its rate, beta, is shaped by sample size, effect size, and study design rather than chosen directly.
- The trade-off: Making alpha stricter to cut Type I errors mechanically raises beta, unless sample size or design also improve.
- Statistical power: The probability of correctly detecting a real effect. It equals 1 minus beta.
- Which is worse? That is a judgement about consequences, not something statistics alone can settle. A drug regulator weighs a false approval more heavily than a screening service weighs a missed case.
- Modern evidence: Widespread neglect of Type II error and power has contributed to psychology’s replication crisis, with many published “significant” results failing to replicate.
Anytime we make a decision using statistics, there are four possible outcomes, with two representing correct decisions and two representing errors. The table below shows all four.
| H0 actually true | H0 actually false | |
|---|---|---|
| Reject H0 | Type I error (rate α) | Correct decision (power, 1 − β) |
| Fail to reject H0 | Correct decision (rate 1 − α) | Type II error (rate β) |
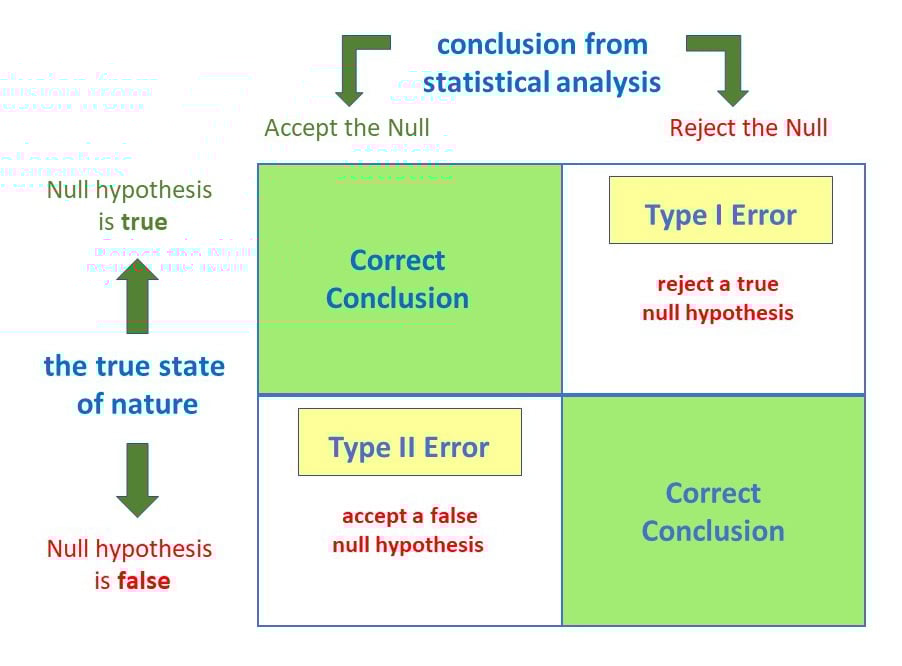
The chances of committing these two types of errors are inversely proportional: that is, decreasing type I error rate increases type II error rate and vice versa.
As the significance level (α) increases, it becomes easier to reject the null hypothesis, decreasing the chance of missing a real effect (Type II error, β). If the significance level (α) goes down, it becomes harder to reject the null hypothesis, increasing the chance of missing an effect while reducing the risk of falsely finding one (Type I error).
Type I error
A type 1 error is also known as a false positive and occurs when a researcher incorrectly rejects a true null hypothesis. Simply put, it’s a false alarm.
This means that you report that your findings are significant when they have occurred by chance.
The probability of making a type 1 error is represented by your alpha level (α), the p-value below which you reject the null hypothesis.
A p-value of 0.05 indicates that you are willing to accept a 5% chance of getting the observed data (or something more extreme) when the null hypothesis is true.
You can reduce your risk of committing a type 1 error by setting a lower alpha level (like α = 0.01). Stricter alpha, fewer false alarms. For example, a p-value of 0.01 would mean there is a 1% chance of committing a Type I error.
However, using a lower value for alpha means that you will be less likely to detect a true difference if one really exists (thus risking a type II error).
Example
Scenario: Drug Efficacy Study
Imagine a pharmaceutical company is testing a new drug, named “MediCure”, to determine if it’s more effective than a placebo at reducing fever. They experimented with two groups: one receives MediCure, and the other received a placebo.
- Null Hypothesis (H0): MediCure is no more effective at reducing fever than the placebo.
- Alternative Hypothesis (H1): MediCure is more effective at reducing fever than the placebo.
After conducting the study and analyzing the results, the researchers found a p-value of 0.04.
If they use an alpha (α) level of 0.05, this p-value is considered statistically significant. They therefore reject the null hypothesis and conclude that MediCure is more effective than the placebo. This looks convincing.
However, MediCure has no actual effect, and the observed difference was due to random variation or some other confounding factor. In this case, the researchers have incorrectly rejected a true null hypothesis.
Error: The researchers have made a Type 1 error by concluding that MediCure is more effective when it isn’t.
Implications
-
Resource Allocation: Making a Type I error can lead to wastage of resources. If a business believes a new strategy is effective when it’s not (based on a Type I error), they might allocate significant financial and human resources toward that ineffective strategy.
-
Unnecessary Interventions: In medical trials, a Type I error might lead to the belief that a new treatment is effective when it isn’t. As a result, patients might undergo unnecessary treatments, risking potential side effects without any benefit.
-
Reputation and Credibility: For researchers, making repeated Type I errors can harm their professional reputation. If they frequently claim groundbreaking results that are later refuted, their credibility in the scientific community might diminish.
Type II error
A type 2 error (or false negative) happens when you accept the null hypothesis when it should actually be rejected.
Here, a researcher concludes there is not a significant effect when actually there really is.
The probability of making a type II error is called Beta (β), a rate linked to the statistical test’s power, where power equals 1 minus beta. You can decrease your risk of committing a type II error by ensuring your test has enough power. More power costs more data.
You can do this by ensuring your sample size is large enough to detect a practical difference when one truly exists.
Example
Scenario: Efficacy of a New Teaching Method
Educational psychologists are investigating the potential benefits of a new interactive teaching method, named “EduInteract”, which utilizes virtual reality (VR) technology to teach history to middle school students.
They hypothesize that this method will lead to better retention and understanding compared to the traditional textbook-based approach.
- Null Hypothesis (H0): The EduInteract VR teaching method does not result in significantly better retention and understanding of history content than the traditional textbook method.
- Alternative Hypothesis (H1): The EduInteract VR teaching method results in significantly better retention and understanding of history content than the traditional textbook method.
The researchers designed an experiment to test this. One group of students learned a history module using the EduInteract VR method. A control group learned the same module using a traditional textbook.
After a week, they were tested. A standardized assessment measured retention and understanding.
Upon analyzing the results, the psychologists found a p-value of 0.06. Using an alpha (α) level of 0.05, this p-value isn’t statistically significant.
Therefore, they fail to reject the null hypothesis. They conclude the EduInteract VR method isn’t more effective than the traditional textbook approach.
However, imagine that in the real world EduInteract VR truly does enhance retention and understanding. That crosses no threshold on paper, yet the benefit is real.
The study simply failed to detect it.
Possible reasons include a small sample size, variability in students’ prior knowledge, or an assessment not sensitive enough to catch VR’s effect.
Error: By concluding that the EduInteract VR method isn’t more effective than the traditional method when it is, the researchers have made a Type 2 error.
This could prevent schools from adopting a potentially superior teaching method that might benefit students’ learning experiences.
Implications
-
Missed Opportunities: A Type II error can lead to missed opportunities for improvement or innovation. For example, in education, if a more effective teaching method is overlooked because of a Type II error, students might miss out on a better learning experience.
-
Potential Risks: In healthcare, a Type II error might mean overlooking a harmful side effect of a medication because the research didn’t detect its harmful impacts. As a result, patients might continue using a harmful treatment.
-
Stagnation: In the business world, making a Type II error can result in continued investment in outdated or less efficient methods. This can lead to stagnation and the inability to compete effectively in the marketplace.
Critical Evaluation
The table above looks like settled statistical bookkeeping. Its history and its use in practice are both more contested than that.
The Neyman-Pearson Framework
This decision-based table did not appear with significance testing itself.
Ronald Fisher’s original test compared a single null hypothesis against the data and reported a p-value as a continuous measure of how surprising the data were.
It set no pre-specified alternative and no fixed decision rule.
Aim: Jerzy Neyman and Egon Pearson set out to put hypothesis testing on an objective mathematical footing (Neyman & Pearson, 1933).
They wanted a formal decision procedure, not a measure of evidence.
Method: Neyman and Pearson formalised a test as a choice between a null and an explicit alternative hypothesis.
The rule was fixed in advance.
So were both error rates, before data collection.
Results: They proved that for a simple null against a simple alternative, there is a single most powerful test.
No other test does better at that size.
Conclusion: Setting alpha at .05, computing power, and running an a priori power analysis are all Neyman-Pearson conventions, not Fisherian ones.
Contemporary practice actually blends the two traditions.
Later methodologists argue this hybrid clouds what a “significant” result is actually claiming.
Contemporary Research
Two threads of research since 2015 speak directly to the Type I/Type II trade-off.
One is hard evidence of real damage.
Neglecting Type II error and statistical power has measurably degraded the published psychology literature.
The other is more conceptual.
It clarifies exactly what a significance test does, and does not, tell a researcher about either error.
Aim: The Open Science Collaboration set out to estimate how reproducible published findings actually are.
Did a “significant” result mean it was real?
Method: A large multi-site collaboration selected 100 studies published in 2008 in three major psychology journals.
Each was directly replicated, as closely as possible.
Results: In the original studies, 97% had reported a statistically significant result; among the replications, only 36% did.
The effect sizes shrank too.
Only 47% of the original effect sizes fell within the 95% confidence interval of the replication’s own estimate.
Conclusion: A large share of “significant” findings that passed the field’s Type I error safeguard did not replicate.
Controlling alpha at 5% guarantees nothing alone.
Statistical power has to be managed too, or the safeguard is empty (Open Science Collaboration, 2015).
That finding is not an outlier.
An analysis of small-sample neuroscience research found median power low enough that many “significant” results were likely false (Button et al., 2013).
Low power inflates false positives field-wide.
Researchers also showed that the many defensible analytic choices in any dataset can inflate the true false-positive rate.
Exploiting that flexibility rarely feels like misconduct.
It can still push a null result past the .05 threshold far more often than the nominal rate implies (Simmons et al., 2011).
One review makes this vivid.
Even when nothing has gone wrong, two well-powered studies of a real effect each have only a 64% chance of both reaching significance.
A “failed” replication can simply be the mathematics of power, not a real disagreement (Greenland et al., 2016).
FAQs
How do Type I and Type II errors relate to psychological research and experiments?
Type I errors are like false alarms, while Type II errors are like missed opportunities. Both errors can impact the validity and reliability of psychological findings, so researchers strive to minimize them to draw accurate conclusions from their studies.
How does sample size influence the likelihood of Type I and Type II errors in psychological research?
Sample size in psychological research influences the likelihood of Type I and Type II errors. A larger sample size reduces the chances of Type I errors, which means researchers are less likely to mistakenly find a significant effect when there isn’t one.
A larger sample size also increases the chances of detecting true effects, reducing the likelihood of Type II errors.
Are there any ethical implications associated with Type I and Type II errors in psychological research?
Yes, there are ethical implications associated with Type I and Type II errors in psychological research.
Type I errors may lead to false positive findings, resulting in misleading conclusions and potentially wasting resources on ineffective interventions. This can harm individuals who are falsely diagnosed or receive unnecessary treatments.
The reverse risk matters too. Type II errors, on the other hand, may result in missed opportunities to identify important effects or relationships, leading to a lack of appropriate interventions or support. This can also have negative consequences for individuals who genuinely require assistance.
Therefore, minimizing these errors is crucial for ethical research and ensuring the well-being of participants.
References
Button, K. S., Ioannidis, J. P. A., Mokrysz, C., Nosek, B. A., Flint, J., Robinson, E. S. J., & Munafò, M. R. (2013). Power failure: Why small sample size undermines the reliability of neuroscience. Nature Reviews Neuroscience, 14(5), 365–376. https://doi.org/10.1038/nrn3475
Greenland, S., Senn, S. J., Rothman, K. J., Carlin, J. B., Poole, C., Goodman, S. N., & Altman, D. G. (2016). Statistical tests, P values, confidence intervals, and power: A guide to misinterpretations. European Journal of Epidemiology, 31(4), 337–350. https://doi.org/10.1007/s10654-016-0149-3
Neyman, J., & Pearson, E. S. (1933). On the problem of the most efficient tests of statistical hypotheses. Philosophical Transactions of the Royal Society A, 231(694–706), 289–337. https://doi.org/10.1098/rsta.1933.0009
Open Science Collaboration. (2015). Estimating the reproducibility of psychological science. Science, 349(6251), aac4716. https://doi.org/10.1126/science.aac4716
Simmons, J. P., Nelson, L. D., & Simonsohn, U. (2011). False-positive psychology: Undisclosed flexibility in data collection and analysis allows presenting anything as significant. Psychological Science, 22(11), 1359–1366. https://doi.org/10.1177/0956797611417632