The peak is the tallest part of the distribution, and the tails are the ends of the distribution.
Types of Kurtosis
There are three types of kurtosis: mesokurtic, leptokurtic, and platykurtic.

- Mesokurtic: Distributions that are moderate in breadth and curves with a medium peaked height.
- Leptokurtic: More values in the distribution tails and more values close to the mean (i.e., sharply peaked with heavy tails)
- Platykurtic: Fewer values in the tails and fewer values close to the mean (i.e., the curve has a flat peak and has more dispersed scores with lighter tails).
Normal kurtosis
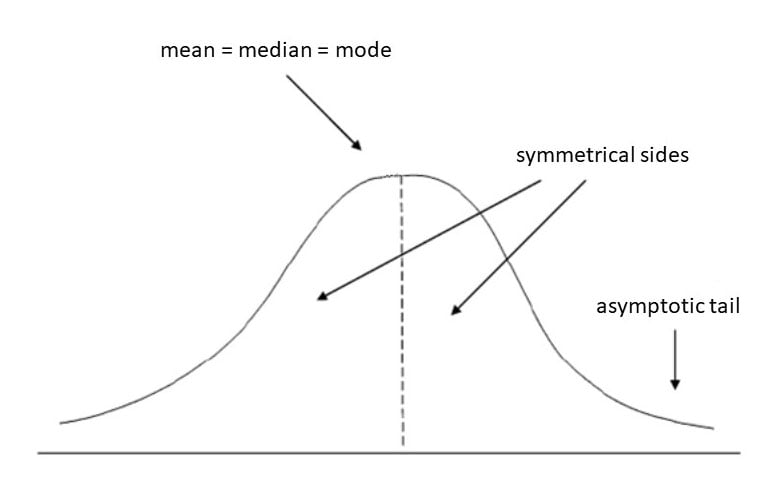
When kurtosis is equal to 3, the distribution is mesokurtic.
This means the kurtosis is the same as the normal distribution; it is mesokurtic (medium peak).
The kurtosis of a mesokurtic distribution is neither high nor low; rather, it is considered to be a baseline for the two other classifications.
IQ scores in the general population are a familiar example. They cluster around the average without an unusually sharp peak or unusually heavy tails, which is exactly the shape a mesokurtic distribution predicts.
Negative kurtosis
Negative excess values of kurtosis (<3) indicate that the distribution is flat and has thin tails. Platykurtic distributions have negative kurtosis values.
A platykurtic distribution is flatter (less peaked) when compared with the normal distribution, with fewer values in its shorter (i.e., lighter and thinner) tails.
A group with genuinely varied, unpracticed strategies on a new task shows this pattern well. Response times spread fairly evenly across a moderate range, with no single time especially typical and few extreme outliers in either direction.

Positive kurtosis
Positive excess values of kurtosis (> 3) indicate that distribution is peaked and possesses thick tails. Leptokurtic distributions have positive kurtosis values.
A leptokurtic distribution has a higher peak (thin bell) and taller (i.e., fatter and heavy) tails than a normal distribution.

A skilled typist’s keystroke timing is a good real-world example. Most intervals cluster tightly around the practised rhythm, producing the sharp central peak, while occasional lapses or anticipatory errors create the heavier tails.
An extreme positive kurtosis indicates a distribution where more of the values are located in the tails of the distribution rather than around the mean.
Critical Evaluation
Kurtosis is easy to calculate, but interpreting a value is less settled than introductory teaching suggests.
No single cutoff commands agreement in the research literature. How much a departure from the normal baseline matters depends on which statistical test is being used.
No Single Cutoff
Introductory courses often treat a kurtosis value beyond roughly ±2 as automatically problematic. The primary literature does not support one fixed number.
Formal tests check for departure from normality directly instead.
The Shapiro–Wilk test compares a sample’s ordered values against what normality would predict. The D’Agostino–Pearson omnibus test combines separate tests of skewness and kurtosis into one statistic. Both return a p-value for the hypothesis that the sample came from a normal population.
Neither test relies on a fixed cutoff.
A large, earlier survey found the same pattern from a different angle. Virtually every one of 440 published psychological and educational measures examined was significantly non-normal (Micceri, 1989).
Non-normality was the norm, not the exception.
Real data, in other words, is more often non-normal than a textbook assumes. Checking shape before trusting a mean is standard practice for exactly this reason.
Contemporary Research
The strongest evidence on how common non-normal data actually is comes from a large survey of published research.
Aim: Cain, Zhang, and Yuan (2017) asked how often published psychological data actually depart from normality, and what that costs common statistical tests.
Method: They gathered 1,567 skewness and kurtosis values from 194 published studies, then simulated how varying non-normality affected a t-test and a factor analysis.
The results were striking.
Results: Seventy-four percent of the distributions sampled deviated meaningfully from normality. Under some of the more severe conditions observed, Type I error rates rose to 17% for the t-test and 30% for the factor analysis.
Conclusion: Non-normal data this severe is common rather than rare. Cain et al. (2017) argued that researchers should routinely report skewness and kurtosis alongside means, instead of assuming normality by default.
A separate large simulation study reached a more reassuring conclusion for the most commonly used test of all.
Blanca, Alarcón, Arnau, Bono, and Bendayan (2017) tested the one-way ANOVA F-test across a wide range of non-normal distribution shapes and sample-size imbalances modelled on real health and social-science data.
It held. The F-test’s nominal Type I error rate stayed accurate in every condition they tested.
The two studies do not simply disagree. Together, they show that how much skew or kurtosis matters depends on which test is being run, not on the shape statistic alone.
Key Takeaways
- Kurtosis: Describes how heavy the tails and how peaked the centre of a distribution are, compared with the normal distribution.
- Three Types: Mesokurtic (normal-like), leptokurtic (sharper peak, heavier tails), and platykurtic (flatter peak, lighter tails).
- Mesokurtic Baseline: A raw kurtosis of 3 matches the normal distribution and is the baseline the other two types are judged against.
- No Fixed Cutoff: How much a departure from this baseline matters depends on the statistical test being used, not on a single rule-of-thumb number.
- Why It Matters: Checking kurtosis helps researchers decide whether a parametric test’s normality assumption is safe to rely on.
References
Blanca, M. J., Alarcón, R., Arnau, J., Bono, R., & Bendayan, R. (2017). Non-normal data: Is ANOVA still a valid option? Psicothema, 29(4), 552–557. https://doi.org/10.7334/psicothema2016.383
Cain, M. K., Zhang, Z., & Yuan, K.-H. (2017). Univariate and multivariate skewness and kurtosis for measuring nonnormality: Prevalence, influence and estimation. Behavior Research Methods, 49(5), 1716–1735. https://doi.org/10.3758/s13428-016-0814-1
Micceri, T. (1989). The unicorn, the normal curve, and other improbable creatures. Psychological Bulletin, 105(1), 156–166. https://doi.org/10.1037/0033-2909.105.1.156