Meta-analysis is a statistical method that combines the results of several independent studies into a single, more precise estimate of an effect. Pooling many studies this way, often built on well-designed randomized controlled trials, gives more statistical power than any one study could offer alone.
Key Takeaways
- Definition: Meta-analysis statistically pools the results of multiple independent studies into one weighted-average effect size, giving more precision than any single study.
- Effect Size: Studies are combined using a standardised effect size, not statistical significance, because significance alone confounds effect magnitude with sample size.
- Fixed vs Random: A fixed-effect model assumes one true effect and weights studies by precision alone. A random-effects model lets the true effect vary between studies and is usually the safer default in psychology.
- Protocol First: A credible meta-analysis pre-registers its research question, search strategy, and inclusion criteria before looking at the results, following PRISMA guidelines.
- Publication Bias: Studies with significant results are more likely to be published, which can inflate the pooled estimate. Funnel plots and Egger’s test help detect this bias.
- Trustworthiness: Benchmarked against bias-free replications, published meta-analyses have been found to overstate effects by close to threefold on average.
What is a Meta-Analysis?
Meta-analysis is a statistical procedure that combines findings from multiple independent studies into one estimate. It reports an average effect size: a standardised measure of how large an effect is, comparable across studies whatever the original measurement scale.
This goes beyond a narrative review’s prose summary. Statistical pooling gives a more objective appraisal of the evidence.
It also fixes a common problem: small individual studies. Pooling many of them yields a far more precise estimate of a treatment effect or relationship strength.
Meta-analyses are especially valuable when individual studies disagree, as with vitamin D supplementation and fracture prevention. Consider one example.
A 2017 meta-analysis in JAMA by Zhao et al. pooled 81 randomized controlled trials and 53,537 participants. Vitamin D supplementation was not linked to a lower fracture risk in community-dwelling adults. That result contradicted earlier beliefs.
What’s the difference between a meta-analysis, systematic review, and literature review?
Literature reviews can be conducted without defined procedures for gathering information. Systematic reviews use strict protocols to minimize bias when gathering and evaluating studies, making them more transparent and reproducible.
While a systematic review thoroughly maps out a field of research, it cannot provide unbiased information on the magnitude of an effect.
Meta-analysis statistically combines effect sizes of similar studies, going a step further than a systematic review by weighting each study by its precision.
What is Effect Size?
Statistical significance is a poor metric in meta-analysis because it only indicates whether an effect is likely to have occurred by chance. It does not provide information about the magnitude or practical importance of the effect.
While a statistically significant result may indicate an effect different from zero, this effect might be too small to hold practical value.
Effect size, on the other hand, offers a standardized measure of the magnitude of the effect, allowing for a more meaningful interpretation of the findings
Meta-analysis goes beyond simply synthesizing effect sizes; it uses these statistics to provide a weighted average effect size from studies addressing similar research questions. The larger the effect size the stronger the relationship between two variables.
If effect sizes are consistent, the analysis demonstrates that the findings are robust across the included studies. When there is variation in effect sizes, researchers should focus on understanding the reasons for this dispersion rather than just reporting a summary effect.
Meta-regression is one method for exploring this variation by examining the relationship between effect sizes and study characteristics.
There are three primary families of effect sizes used in most meta-analyses:
- Mean difference effect sizes: Used to show the magnitude of the difference between means of groups or conditions, commonly used when comparing a treatment and control group.
- Correlation effect sizes: Represent the degree of association between two continuous measures, indicating the strength and direction of their relationship.
- Odds ratio effect sizes: Used with binary outcomes to compare the odds of an event occurring between two groups, like whether a patient recovers from an illness or not.
The most appropriate effect size family is determined by the nature of the research question and dependent variable. All common effect sizes are able to be transformed from one version to another.
How to Conduct a Meta-Analysis
Researchers should develop a comprehensive research protocol that outlines the objectives and hypotheses of their meta-analysis.
This document should provide specific details about every stage of the research process, including the methodology for identifying, selecting, and analyzing relevant studies.
For example, the protocol should specify search strategies for relevant studies, including whether the search will encompass unpublished works.
The protocol should be created before beginning the research process to ensure transparency and reproducibility.
Research Protocol
Objectives
- To estimate the overall effect of growth mindset interventions on the academic achievement of students in primary and secondary school.
- To investigate if the effect of growth mindset interventions on academic achievement differs for students of different ages (e.g., elementary school students vs. high school students).
- To examine if the duration of the growth mindset intervention impacts its effectiveness.
Hypotheses
- Growth mindset interventions will have a small, but statistically significant, positive effect on student academic achievement.
- Growth mindset interventions will be more effective for younger students than for older students.
- Longer growth mindset interventions will be more effective than shorter interventions.
Eligibility Criteria
- Published studies in English-language journals.
- Studies must include a quantitative measure of academic achievement (e.g., GPA, course grades, exam scores, or standardized test scores).
- Studies must involve a growth mindset intervention as the primary focus (including control vs treatment group comparison).
- Studies that combine growth mindset training with other interventions (e.g., study skills training, other types of psychological interventions) should be excluded.
Search Strategy
The researchers will search the following databases:
- ERIC
- PsycInfo
- PubMed
Keywords Combined with Boolean Operators:
- (“growth mindset” OR “implicit theories of intelligence” OR “mindset theory”) AND (“intervention” OR “training” OR “program”) ” OR “educational outcomes”)* OR “pupil” OR “learner*”)**
Additional Search Strategies:
- Citation Chaining: Examining the reference lists of included studies can uncover additional relevant articles.
- Contacting Experts: Reaching out to researchers in the field of growth mindset can reveal unpublished studies or ongoing research.
Coding of Studies
The researchers will code each study for the following information:
- Sample size
- Age of participants
- Duration of intervention
- Type of academic outcome measured
- Study design (e.g., randomized controlled trial, quasi-experiment)
Statistical Analysis
- The researchers will calculate an effect size (e.g., standardized mean difference) for each study.
- The researchers will use a random-effects model (which assumes the true effect can vary from study to study, rather than being one fixed number) to account for variation in effect sizes across studies.
- The researchers will use meta-regression to test the hypotheses about moderators of the effect of growth mindset interventions.
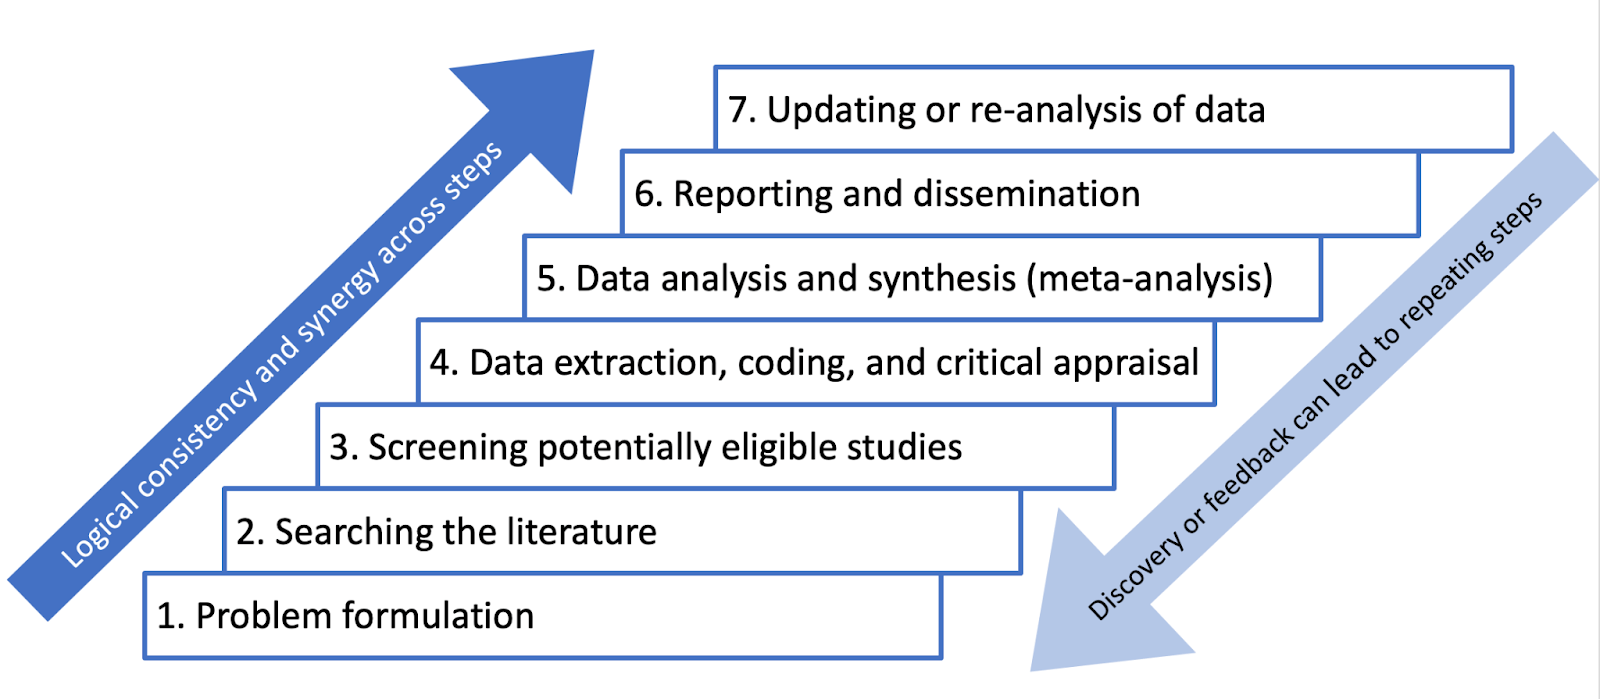
PRISMA
PRISMA (Preferred Reporting Items for Systematic Reviews and Meta-Analyses) is a reporting guideline designed to improve the transparency and completeness of systematic review reporting.
PRISMA was created to tackle the issue of inadequate reporting often found in systematic reviews
- Checklist: PRISMA features a 27-item checklist covering all aspects of a meta-analysis, from the rationale and objectives to the synthesis of findings and discussion of limitations. Each checklist item is accompanied by detailed reporting recommendations in an Explanation and Elaboration document.
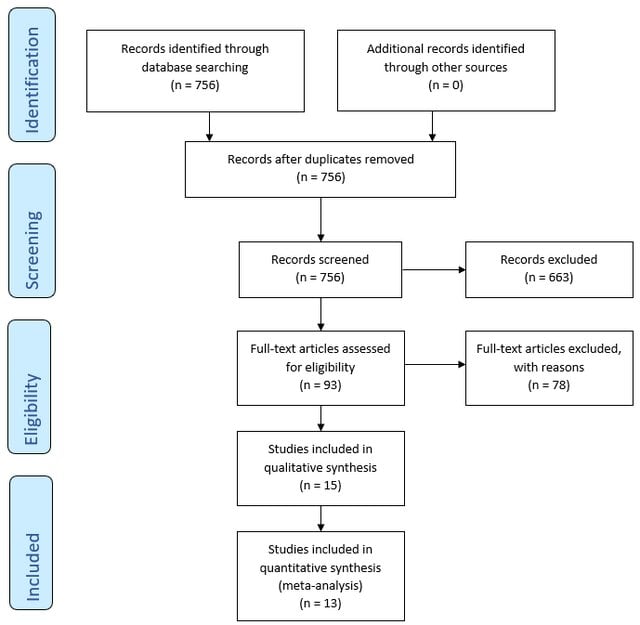
- Flow Diagram: PRISMA also includes a flow diagram to visually represent the study selection process, offering a clear, standardized way to illustrate how researchers arrived at the final set of included studies
Step 1: Defining a Research Question
A well-defined research question is a fundamental starting point for any research synthesis. The research question should guide decisions about which studies to include in the meta-analysis, and which statistical model is most appropriate.
For example:
- How do dysfunctional attitudes and negative automatic thinking directly and indirectly impact depression?
- Do growth mindset interventions generally improve students’ academic achievement?
- What is the association between child-parent attachment and prosociality in children?
- What is the relation of various risk factors to Post Traumatic Stress Disorder (PTSD)?
Researchers should develop a comprehensive research protocol that outlines the objectives and hypotheses of their meta-analysis.
Step 2: Search Strategy
Present the full search strategies for all databases, registers and websites, including any filters and limits used.
PRISMA 2020 Checklist
A search strategy is a comprehensive and reproducible plan for identifying all relevant research studies that address a specific research question.
This systematic approach to searching helps minimize bias.
It’s important to be transparent about the search strategy and document all decisions for auditability. The goal is to identify all potentially relevant studies for consideration.
PRISMA (Preferred Reporting Items for Systematic reviews and Meta-Analyses) provide appropriate guidance for reporting quantitative literature searches.
Information Sources
The primary goal is to find all published and unpublished studies that meet the predefined criteria of the research question. This includes considering various sources beyond typical databases.
Information sources for a meta-analysis can include a wide range of resources like scholarly databases, unpublished literature, conference papers, books, and even expert consultations.
Specify all databases, registers, websites, organisations, reference lists and other sources searched or consulted to identify studies. Specify the date when each source was last searched or consulted.
PRISMA 2020 Checklist
An exhaustive, systematic search strategy is developed with the assistance of an expert librarian.
- Databases: Searches should include seven key databases: CINAHL, Medline, APA PsycArticles, Psychology and Behavioral Sciences Collection, APA PsycInfo, SocINDEX with Full Text, and Web of Science: Core Collections.
- Grey Literature: In addition to databases, forensic or ‘expansive’ searches can be conducted. This includes: grey literature database searches (e.g. OpenGrey,WorldCat, Ethos), conference proceedings, unpublished reports, theses , clinical trial databases, searches by names of authors of relevant publications. Independent research bodies may also be good sources of material, e.g. Centre for Research in Ethnic Relations, Joseph Rowntree Foundation, Carers UK.
- Citation Searching: Reference lists often lead to highly cited and influential papers in the field, providing valuable context and background information for the review.
- Contacting Experts: Reaching out to researchers or experts in the field can provide access to unpublished data or ongoing research not yet publicly available.
Other databases may also hold relevant studies beyond those listed here.
Search String Construction
It is recommended to consult topic experts on the review team and advisory board in order to create as complete a list of search terms as possible for each concept.
To retrieve the most relevant results, a search string is used. This string is made up of:
- Keywords: Search terms should be relevant to the research questions, key variables, participants, and research design. Searches should include indexed terms, titles, and abstracts. Additionally, each database has specific indexed terms, so a targeted search strategy must be created for each database.
- Synonyms: These are words or phrases with similar meanings to the keywords, as authors may use different terms to describe the same concepts. Including synonyms helps cover variations in terminology and increases the chances of finding all relevant studies. For example, a drug intervention may be referred to by its generic name or by one of its several proprietary names.
- Truncation symbols: These broaden the search by capturing variations of a keyword. They function by locating every word that begins with a specific root. For example, if a user was researching interventions for smoking, they might use a truncation symbol to search for “smok*” to retrieve records with the words “smoke,” “smoker,” “smoking,” or “smokes.” This can save time and effort by eliminating the need to input every variation of a word into a database.
- Boolean operators: The use of Boolean operators (AND/OR/NEAR/NOT) helps to combine these terms effectively, ensuring that the search strategy is both sensitive and specific. For instance, using “AND” narrows the search to include only results containing both terms, while “OR” expands it to include results containing either term.
When conducting these searches, it is important to combine browsing of texts (publications) with periods of more focused systematic searching. This iterative process allows the search to evolve as the review progresses.
This guidance can go out of date as databases update their search syntax, so treat it as a starting point rather than the final word.
Example:
Studies were identified by searching PubMed, PsycINFO, and the Cochrane Library. We conducted searches for studies published between the first available year and April 1, 2009, using the search term mindfulness combined with the terms meditation, program, therapy, or intervention and anxi, depress, mood, or stress. Additionally, an extensive manual review was conducted of reference lists of relevant studies and review articles extracted from the database searches. Articles determined to be related to the topic of mindfulness were selected for further examination.
Source: Hofmann, S. G., Sawyer, A. T., Witt, A. A., & Oh, D. (2010). The effect of mindfulness-based therapy on anxiety and depression: A meta-analytic review. Journal of consulting and clinical psychology, 78(2), 169.
Eligibility Criteria
Specify the inclusion and exclusion criteria for the review.
PRISMA 2020 Checklist
Before beginning the literature search, researchers should establish clear eligibility criteria for study inclusion
To maintain transparency and minimize bias, eligibility criteria for study inclusion should be established a priori. Ideally, researchers should aim to include only high-quality randomized controlled trials that adhere to the intention-to-treat principle.
The selection of studies should not be arbitrary, and the rationale behind inclusion and exclusion criteria should be clearly articulated in the research protocol.
When specifying the inclusion and exclusion criteria, consider the following aspects:
- Intervention Characteristics: Researchers might decide that, in order to be included in the review, an intervention must have specific characteristics. They might require the intervention to last for a certain length of time, or they might determine that only interventions with a specific theoretical basis are appropriate for their review.
- Population Characteristics: A meta-analysis might focus on the effects of an intervention for a specific population. For instance, researchers might choose to focus on studies that included only nurses or physicians.
- Outcome Measures: Researchers might choose to include only studies that used outcome measures that met a specific standard.
- Age of Participants: If a meta-analysis is examining the effects of a treatment or intervention for children, the authors of the review will likely choose to exclude any studies that did not include children in the target age range.
- Diagnostic Status of Participants: Researchers conducting a meta-analysis of treatments for anxiety will likely exclude any studies where the participants were not diagnosed with an anxiety disorder.
- Study Design: Researchers might determine that only studies that used a particular research design, such as a randomized controlled trial, will be included in the review.
- Control Group: In a meta-analysis of an intervention, researchers might choose to include only studies that included certain types of control groups, such as a waiting list control or another type of intervention.
- Publication status: Decide whether only published studies will be included or if unpublished works, such as dissertations or conference proceedings, will also be considered.
Example:
Studies were selected if (a) they included a mindfulness-based intervention, (b) they included a clinical sample (i.e., participants had a diagnosable psychological or physical/medical disorder), (c) they included adult samples (18 – 65 years of age), (d) the mindfulness program was not coupled with treatment using acceptance and commitment therapy or dialectical behavior therapy, (e) they included a measure of anxiety and/or mood symptoms at both pre and postintervention, and (f) they provided sufficient data to perform effect size analyses (i.e., means and standard deviations, t or F values, change scores, frequencies, or probability levels). Studies were excluded if the sample overlapped either partially or completely with the sample of another study meeting inclusion criteria for the meta-analysis. In these cases, we selected for
inclusion the study with the larger sample size or more complete data for measures of anxiety and depression symptoms. For studies that provided insufficient data but were otherwise appropriate for
the analyses, authors were contacted for supplementary data.
Source: Hofmann, S. G., Sawyer, A. T., Witt, A. A., & Oh, D. (2010). The effect of mindfulness-based therapy on anxiety and depression: A meta-analytic review. Journal of consulting and clinical psychology, 78(2), 169.
Iterative Process
The iterative nature of developing a search strategy stems from the need to refine and adapt the search process based on the information encountered at each stage.
A single attempt rarely yields the perfect final strategy. Instead, it is an evolving process involving a series of test searches, analysis of results, and discussions among the review team.
Here’s how the iterative process unfolds:
- Initial Strategy Formulation: Based on the research question, the team develops a preliminary search strategy, including identifying relevant keywords, synonyms, databases, and search limits.
- Test Searches and Refinement: The initial search strategy is then tested on chosen databases. The results are reviewed for relevance, and the search strategy is refined accordingly. This might involve adding or modifying keywords, adjusting Boolean operators, or reconsidering the databases used.
- Discussions and Iteration: The search results and proposed refinements are discussed within the review team. The team collaboratively decides on the best modifications to improve the search’s comprehensiveness and relevance.
- Repeating the Cycle: This cycle of test searches, analysis, discussions, and refinements is repeated until the team is satisfied with the strategy’s ability to capture all relevant studies while minimizing irrelevant results.
By constantly refining the search strategy based on the results and feedback, researchers can be more confident that they have identified all relevant studies.
This iterative process ensures that the applied search strategy is sensitive enough to capture all relevant studies while maintaining a manageable scope.
Throughout this process, meticulous documentation of the search strategy, including any modifications, is crucial for transparency and future replication of the meta-analysis.
Searching is a pragmatic activity. If a search identifies 15,000 items and the review team is just two people working in their free time, the scope may need to narrow.
Reviewers can tighten the inclusion criteria, for example by revising the publication-date window (the last ten years rather than twenty) or narrowing the population or study designs.
Step 3: Search the Literature
Conduct a systematic search of the literature using clearly defined search terms and databases.
Applying the search strategy means entering the constructed search strings into each database’s search interface. Precision matters here.
These strings are crafted using Boolean operators, truncation symbols, wildcards, and database-specific syntax to retrieve all potentially relevant studies.
The researcher refines the search as results come in.
This can involve search filters that focus on specific study designs or publication types.
It is not a purely mechanical process. Applying the strategy well demands a thorough understanding of each database’s functionality and a discerning eye for adjusting the search based on retrieved results.
Step 4: Screening & Selecting Research Articles
Once the literature search is complete, the next step is to screen and select the studies that will be included in the meta-analysis.
This involves carefully reviewing each study to determine its relevance to the research question and its methodological quality.
The goal is to identify studies that are both relevant to the research question and of sufficient quality to contribute to a meaningful synthesis.
Reviewers then log each study’s details. These are usually saved into a reference manager, such as Endnote or Mendeley. Recorded fields include the title, authors, date, and journal, plus an abstract where available.
Selection Process
Specify the methods used to decide whether a study met the inclusion criteria of the review, including how many reviewers screened each record and each report retrieved, whether they worked independently, and if applicable, details of automation tools used in the process.
PRISMA 2020 Checklist
The selection process in a meta-analysis involves multiple reviewers to ensure rigor and reliability.
Two reviewers should independently screen titles and abstracts, removing duplicates and irrelevant studies based on predefined inclusion and exclusion criteria.
- Initial screening of titles and abstracts: After applying a strategy to search the literature,, the next step involves screening the titles and abstracts of the identified articles against the predefined inclusion and exclusion criteria. During this initial screening, reviewers aim to identify potentially relevant studies while excluding those clearly outside the scope of the review. It is crucial to prioritize over-inclusion at this stage, meaning that reviewers should err on the side of keeping studies even if there is uncertainty about their relevance. This cautious approach helps minimize the risk of inadvertently excluding potentially valuable studies.
- Retrieving and assessing full texts: For studies which a definitive decision cannot be made based on the title and abstract alone, reviewers need to obtain the full text of the articles for a comprehensive assessment against the predefined inclusion and exclusion criteria. This stage involves meticulously reviewing the full text of each potentially relevant study to determine its eligibility definitively.
- Resolution of Disagreements: In cases of disagreement between reviewers regarding a study’s eligibility, a predefined strategy involving consensus-building discussions or arbitration by a third reviewer should be in place to reach a final decision. This collaborative approach ensures a fair and impartial selection process, further strengthening the review’s reliability.
PRISMA Flowchart
The PRISMA flowchart is a visual representation of the study selection process within a systematic review.
The flowchart illustrates the step-by-step process of screening, filtering, and selecting studies based on predefined inclusion and exclusion criteria.
The flowchart visually depicts the following stages:
- Identification: The initial number of titles and abstracts identified through database searches.
- Screening: The screening process, based on titles and abstracts.
- Eligibility: Full-text copies of the remaining records are retrieved and assessed for eligibility.
- Inclusion: Applying the predefined inclusion criteria resulted in the inclusion of publications that met all the criteria for the review.
- Exclusion: The flowchart details the reasons for excluding the remaining records.
This systematic and transparent approach, as visualized in the PRISMA flowchart, ensures a robust and unbiased selection process, enhancing the reliability of the systematic review’s findings.
The flowchart serves as a visual record of the decisions made during the study selection process, allowing readers to assess the rigor and comprehensiveness of the review.
Step 5: Evaluating the Quality of Studies
Data collection process
Specify the methods used to collect data from reports, including how many reviewers collected data from each report, whether they worked independently, any processes for obtaining or confirming data from study investigators, and if applicable, details of automation tools used in the process.
PRISMA 2020 Checklist
Data extraction focuses on information relevant to the research question, such as risk or recovery factors related to a particular phenomenon.
Extract data relevant to the research question, such as effect sizes, sample sizes, means, standard deviations, and other statistical measures.
It can be useful to focus on the authors’ interpretations of findings rather than individual participant quotes, as the latter lacks the full context of the original data.
Coding of Studies
Coding a meta-analysis means extracting data from each included study. This must be standardized and reliable. Accuracy here matters: it underpins the validity of the meta-analysis’s findings.
The coded information is later used to calculate effect sizes, examine potential moderators, and draw overall conclusions.
Coding procedures typically use a standardized record form or coding protocol. Consistency counts. This guides data extraction from each study in a consistent, organized way. Two independent observers help ensure accuracy and minimize errors.
Beyond authors and publication year, coders also capture study characteristics relevant to the research question.
For example, if the meta-analysis focuses on the effects of a specific therapy, relevant characteristics to code might include:
- Study characteristics: Publicatrion year, authors, country of origin, publication status (Published: Peer-reviewed journal articles and book chapters Unpublished: Government reports, websites, theses/dissertations, conference presentations, unpublished manuscripts).
- Intervention: Type (e.g., CBT), duration of treatment, frequency (e.g., weekly sessions), delivery method (e.g., individual, group, online), intention-to-treat analysis (Yes/No)
- Outcome measures: Primary vs. secondary outcomes, time points of measurement (e.g., post-treatment, follow-up).
- Moderators: Participant characteristics that might moderate the effect size. (e.g., age, gender, diagnosis, socioeconomic status, education level, comorbidities).
- Study design: Design (RCT quasi-experiment, etc.), blinding, control group used (e.g., waitlist control, treatment as usual), study setting (clinical, community, online/remote, inpatient vs. outpatient), pre-registration (yes/no), allocation method (simple randomization, block randomization, etc.).
- Sample: Recruitment method (snowball, random, etc.), sample size (total and groups), sample location (treatment & control group), attrition rate, overlap with sample(s) from another study?
- Adherence to reporting guidelines: e.g., CONSORT, STROBE, PRISMA
- Funding source: Government, industry, non-profit, etc.
- Effect Size: Comprehensive meta-analysis program is used to compute d and/or r. Include up to 3 digits after the decimal point for effect size information and internal consistency information. Also record the page number and table number from which the information is coded. This information helps when checking reliability and accuracy to ensure we are coding from the same information.
Before applying the coding protocol to all studies, it’s crucial to pilot test it on a small subset of studies. This helps identify any ambiguities, inconsistencies, or areas for improvement in the coding protocol before full-scale coding begins.
It’s common to encounter missing data in primary research articles. A clear strategy is needed for handling it. Researchers might contact study authors, use imputation methods, or run sensitivity analyses to check how much the missing data affects the overall results.
Quality Appraisal Tools
Researchers use standardized tools to assess the quality and risk of bias in the quantitative studies included in the meta-analysis. Some commonly used tools include:
- Cochrane Risk of Bias Tool:
- Recommended by the Cochrane Collaboration for assessing randomized controlled trials (RCTs).
- Evaluates potential biases in selection, performance, detection, attrition, and reporting.
- Newcastle-Ottawa Scale (NOS):
- Used for assessing the quality of non-randomized studies, including case-control and cohort studies.
- Evaluates selection, comparability, and outcome assessment.
- ROBINS-I Tool (Risk Of Bias In Non-randomized Studies – of Interventions):
- Assesses risk of bias in non-randomized studies of interventions.
- Evaluates confounding, selection bias, classification of interventions, deviations from intended interventions, missing data, measurement of outcomes, and selection of reported results.
- QUADAS-2 (Quality Assessment of Diagnostic Accuracy Studies):
- Specifically designed for diagnostic accuracy studies.
- Assesses risk of bias and applicability concerns in patient selection, index test, reference standard, and flow and timing.
By using these tools, researchers can ensure that the studies included in their meta-analysis are of high methodological quality and contribute reliable quantitative data to the overall analysis.
Step 6: Choice of Effect Size
The choice of effect size metric is typically determined by the research question and the nature of the dependent variable.
- Odds Ratio (OR): For instance, if researchers are working in medical and health sciences where binary outcomes are common (e.g., yes/no, failed/success), effect sizes like relative risk and odds ratio are often used.
- Mean Difference: Studies focusing on experimental or between-group comparisons often employ mean differences. The raw mean difference, or unstandardized mean difference, is suitable when the scale of measurement is inherently meaningful and comparable across studies.
- Standardized Mean Difference (SMD): If studies use different scales or measures, the standardized mean difference (e.g., Cohen’s d) is more appropriate. When analyzing observational studies, the correlation coefficient is commonly chosen as the effect size.
- Pearson correlation coefficient (r): A statistical measure frequently employed in meta-analysis to examine the strength of the relationship between two continuous variables.
Conversion of efect sizes to a common measure
It may be necessary to convert reported findings to the chosen primary effect size. Why bother? The goal is simple: harmonize different effect-size measures into one common metric for comparison.
This lets researchers include studies that report findings on different metrics. Conversion helps. For instance, r can be converted to d, and vice versa, using standard equations. The same conversion works going from an odds ratio to r.
Rosenthal (1991) sets out the relevant equations.
Step 7: Assessing Heterogeneity
Heterogeneity is the variation in effect sizes across studies that remains after within-study sampling error is accounted for. No variation at all would mean every study showed an identical effect; more variation means more heterogeneity.
This matters. Assessing heterogeneity shows whether an intervention works consistently across contexts, and it guides how the results of multiple studies should be combined and interpreted.
Low heterogeneity allows more confidence in the overall conclusion. Substantial heterogeneity calls for further investigation into its underlying causes.
How to assess heterogeneity
- Homogeneity Test: Meta-analyses typically include a homogeneity test to determine if the effect sizes are estimating the same population parameter. The test statistic, denoted as Q, is a weighted sum of squares that follows a chi-square distribution. A significant Q statistic suggests that the effect sizes are heterogeneous.
- I2 Statistic: The I2 statistic is a relative measure of heterogeneity that represents the ratio of between-study variance (τ2) to the total variance (between-study variance plus within-study variance). Higher I2 values indicate greater heterogeneity.
- Prediction Interval: this is the range within which the true effect of a future study would be expected to fall. A wide prediction interval suggests substantial heterogeneity in the population effect size.
Step 8: Choosing the Meta-Analytic Model
Meta-analysts address heterogeneity by choosing between fixed-effects and random-effects analytical models.
Use a random-effects model if heterogeneity is high. Use a fixed-effect model if heterogeneity is low, or if all studies are functionally identical and you are not seeking to generalize to a range of scenarios.
Although a statistical test for homogeneity can help assess the variability in effect sizes across studies, it shouldn’t dictate the choice between fixed and random effects models.
The decision of which model to use is ultimately a conceptual one, driven by the researcher’s understanding of the research field and the goals of the meta-analysis.
If the number of studies is limited, a fixed-effects analysis is more appropriate, while more studies are required for a stable estimate of the between-study variance in a random-effects model.
A random-effects model is generally the more conservative approach.
Fixed-effects models
- Assumes all studies are measuring the exact same thing
- Gives much more weight to larger studies
- Use when studies are very similar
Fixed-effects models assume that there is one true effect size underlying all studies. The goal is to estimate this common effect size with the greatest precision, which is achieved by minimizing the within-study (sampling).
Consequently, studies are weighted by the inverse of their variance.
This means that larger studies, which generally have smaller variances, are assigned greater weight in the analysis because they provide more precise estimates of the common effect size
- Pros:
- Simplicity: The fixed-effect model is straightforward to implement and interpret, making it computationally simpler.
- Precision: When the assumption of a common effect size is met, fixed-effect models provide more precise estimates with narrower confidence intervals compared to random-effects models.
- Suitable for Conditional Inferences: Fixed-effect models are appropriate when the goal is to make inferences specifically about the studies included in the meta-analysis, without generalizing to a broader population.
- Cons:
- Restrictive Assumptions: The fixed-effect model assumes all studies estimate the same population parameter, which is often unrealistic, particularly with studies drawn from diverse methodologies or populations.
- Limited Generalizability: Findings from fixed-effect models are conditional on the included studies, limiting their generalizability to other contexts or populations.
- Sensitivity to Heterogeneity: Fixed-effect models are sensitive to the presence of heterogeneity among studies, and may produce misleading results if substantial heterogeneity exists.
Random-effects models
- Assumes studies might be measuring slightly different things
- Gives more balanced weight to both large and small studies
- Use when studies might vary in methods or populations
Random-effects models assume the true effect size can vary across studies. Why assume that? The goal is to estimate the mean of these varying effect sizes, considering both within-study and between-study variance.
Each study might estimate a slightly different effect size for reasons beyond sampling error, such as differences in populations, interventions, or designs.
This balanced weighting stops large studies from dominating the overall estimate. The result is more representative. It reflects the true spread of effects across studies.
- Pros:
- Realistic Assumptions: Random-effects models acknowledge the presence of between-study variability by assuming true effects are randomly distributed, making it more suitable for real-world research scenarios.
- Generalizability: Random-effects models allow for broader inferences to be made about a population of studies, enhancing the generalizability of findings.
- Accommodation of Heterogeneity: Random-effects models explicitly model heterogeneity, providing a more accurate representation of the overall effect when studies have varying effect sizes.
- Cons:
- Complexity: Random-effects models are computationally more complex, requiring the estimation of additional parameters, such as between-study variance.
- Reduced Precision: Confidence intervals tend to be wider compared to fixed-effect models, particularly when between-study heterogeneity is substantial.
- Requirement for Sufficient Studies: Accurate estimation of between-study variance necessitates a sufficient number of studies, making random-effects models less reliable with smaller meta-analyses.
Step 9: Perform the Meta-Analysis
This step involves statistically combining effect sizes from chosen studies. Meta-analysis uses the weighted mean of effect sizes, typically giving larger weights to more precise studies (often those with larger sample sizes).
The main function of meta-analysis is to estimate effects in a population by combining the effect sizes from multiple articles.
It uses a weighted mean of the effect sizes, typically giving larger weights to more precise studies, often those with larger sample sizes.
This weighting scheme makes statistical sense because an effect size with good sampling accuracy (i.e., likely to be an accurate reflection of reality) is weighted highly.
On the other hand, effect sizes from studies with lower sampling accuracy are given less weight in the calculations.
the process:
- Calculate weights for each study
- Multiply each study’s effect by its weight
- Add up all these weighted effects
- Divide by the sum of all weights
Estimating effect size using fixed effects
The fixed-effects model in meta-analysis operates under the assumption that all included studies are estimating the same true effect size.
This model focuses solely on within-study variance when determining the weight of each study.
The weight is calculated as the inverse of the within-study variance, which typically results in larger studies receiving substantially more weight in the analysis.
This approach is based on the idea that larger studies provide more precise estimates of the true effect.
The weighted mean effect size (M) is calculated by summing the products of each study’s effect size (ESi) and its corresponding weight (wi) and dividing that sum by the total sum of the weights:
1. Calculate weights (wi) for each study:
The weight is often the inverse of the variance of the effect size. This means studies with larger sample sizes and less variability carry more weight, since they give more precise estimates.
Why? This weighting scheme reflects a core assumption of the fixed-effect model: every study estimates the same true effect size, and any differences between them are just sampling error.
Studies with less sampling error, in other words smaller variances, are treated as more reliable and given more weight in the analysis.
Here’s the formula for calculating the weight in a fixed-effect meta-analysis:
Wi = 1 / VYi1
- Wi represents the weight assigned to study i.
- VYi is the within-study variance for study i.
Practical steps:
- The weight for each study is calculated as: Weight = 1 / (within-study variance)
- For example: Let’s say a study reports a within-study variance of 0.04. The weight for this study would be: 1 / 0.04 = 25
- Calculate the weight for every study included in your meta-analysis using this method.
- These weights will be used in subsequent calculations, such as computing the weighted mean effect size.
- Note: In a fixed-effects model, we do not calculate or use τ² (tau squared), which represents between-study variance. This is only used in random-effects models.
2. Multiply each study’s effect by its weight:
After calculating the weight for each study, multiply the effect size by its corresponding weight. This step is crucial because it ensures that studies with more precise effect size estimates contribute proportionally more to the overall weighted mean effect size
- For each study, multiply its effect size by the weight we just calculated.
3. Add up all these weighted effects:
- Sum up all the products from step 2.
4. Divide by the sum of all weights:
- Add up all the weights we calculated in step 1.
- Divide the sum from step 3 by this total weight.
Implications of the fixed-effects model
- Larger studies (with smaller within-study variance) receive substantially more weight.
- This model assumes that differences between study results are due only to sampling error.
- It’s most appropriate when studies are very similar in methods and sample characteristics.
Estimating effect size using random effects
Random-effects meta-analysis is more complex. Multiple sources of difference can affect each study’s effect size, and the model must account for all of them. So the maths must adapt.
The key addition is τ² (tau squared) in the weight calculation. This term captures between-study heterogeneity: the chance that studies are measuring slightly different effects, not just sampling noise.
The result is an overall effect size that weighs both within-study and between-study variability, fitting research where studies differ in methods or populations. Doing this well needs enough studies.
The model must also estimate the variance of the true effect sizes, τ², which is unstable with very few studies. Estimation is typically done using statistical software, often via restricted maximum likelihood (REML).
1. Calculate weights for each study:
In a random-effects meta-analysis, the weight assigned to each study (W*i) is calculated as the inverse of that study’s variance, similar to a fixed-effect model. However, the variance in a random-effects model considers both the within-study variance (VYi) and the between-studies variance (T^2).
The inclusion of T^2 in the denominator of the weight formula reflects the random-effects model’s assumption that the true effect size can vary across studies.
This means that in addition to sampling error, there is another source of variability that needs to be accounted for when weighting the studies. The between-studies variance, T^2, represents this additional source of variability.
Here’s the formula for calculating the weight in a random-effects meta-analysis:
W*i = 1 / (VYi + T^2)
- W*i represents the weight assigned to study i.
- VYi is the within-study variance for study i.
- T^2 is the estimated between-studies variance.
Practical steps:
First, we need to calculate something called τ² (tau squared). This represents the between-study variance.
The estimation of T^2 can be done using different methods, one common approach being the method of moments (DerSimonian and Laird method).
The formula for T^2 using the method of moments is: T^2 = (Q – df) / C
- Q is the homogeneity statistic.
- df is the degrees of freedom (number of studies -1).
- C is a constant calculated based on the study weights
- The weight for each study is then calculated as: Weight = 1 / (within-study variance + τ²). This is different from the fixed effects model because we’re adding τ² to account for between-study variability.
2. Multiply each study’s effect by its weight:
- For each study, multiply its effect size by the weight we just calculated.
3. Add up all these weighted effects:
Sum up all the products from step 2.
4. Divide by the sum of all weights:
Add up all the weights we calculated in step 1. Divide the sum from step 3 by this total weight
Implications of the random-effects model
- Weights are more balanced between large and small studies compared to the fixed-effects model.
- It’s most appropriate when studies vary in methods, sample characteristics, or other factors that might influence the true effect size.
- The random-effects model typically produces wider confidence intervals, reflecting the additional uncertainty from between-study variability.
- Results are more generalizable to a broader population of studies beyond those included in the meta-analysis.
- This model is often more realistic for social and behavioral sciences, where true effects may vary across different contexts or populations.
Step 10: Sensitivity Analysis
Assess the robustness of your findings by repeating the analysis using different statistical methods, models (fixed-effects and random-effects), or inclusion criteria. This helps determine how sensitive your results are to the choices made during the process.
Sensitivity analysis strengthens a meta-analysis by revealing how robust the findings are to the various decisions and assumptions made during the process. It helps to determine if the conclusions drawn from the meta-analysis hold up when different methods, criteria, or data subsets are used.
This is especially important since opinions may differ on the best approach to conducting a meta-analysis, making the exploration of these variations crucial.
Here are some key ways sensitivity analysis contributes to a more robust meta-analysis:
- Assessing Impact of Different Statistical Methods: A sensitivity analysis can involve calculating the overall effect using different statistical methods, such as fixed and random effects models. This comparison helps determine if the chosen statistical model significantly influences the overall results. For instance, in the meta-analysis of β-blockers after myocardial infarction, both fixed and random effects models yielded almost identical overall estimates. This suggests that the meta-analysis findings are resilient to the statistical method employed.
- Evaluating the Influence of Trial Quality and Size: By analyzing the data with and without trials of questionable quality or varying sizes, researchers can assess the impact of these factors on the overall findings.
- Examining the Effect of Trials Stopped Early: Including trials that were stopped early due to interim analysis results can introduce bias. Sensitivity analysis helps determine if the inclusion or exclusion of such trials noticeably changes the overall effect. In the example of the β-blocker meta-analysis, excluding trials stopped early had a negligible impact on the overall estimate.
- Addressing Publication Bias: It’s essential to assess and account for publication bias, which occurs when studies with statistically significant results are more likely to be published than those with null or nonsignificant findings. This can be accomplished with funnel plots, statistical tests such as Egger’s test (a regression of each study’s effect size on its precision, used to detect the tell-tale link between a study’s size and its result), and sensitivity analyses.
By systematically varying different aspects of the meta-analysis, researchers can assess the robustness of their findings and address potential concerns about the validity of their conclusions.
This process ensures a more reliable and trustworthy synthesis of the research evidence.
Common Mistakes
When conducting a meta-analysis, several common pitfalls can arise, potentially undermining the validity and reliability of the findings. Sources caution against these mistakes and offer guidance on conducting methodologically sound meta-analyses.
- Insufficient Number of Studies: If there are too few primary studies available, a meta-analysis might not be appropriate. While a meta-analysis can technically be conducted with only two studies, the research community might not view findings based on a limited number of studies as reliable evidence. A small number of studies could suggest that the research field is not mature enough for meaningful synthesis.
- Inappropriate Combination of Studies: Meta-analyses should not simply combine studies indiscriminately. Avoid the “apples and oranges” problem, where studies with different research objectives, designs, measures, or samples are inappropriately combined. Such practices can obscure important differences between studies and lead to misleading conclusions.
- Misinterpreting Heterogeneity: One common mistake is using the Q statistic or p-value from a test of heterogeneity as the sole indicator of heterogeneity. While these statistics can signal heterogeneity, they do not quantify the extent of variation in effect sizes.
- Over-Reliance on Published Studies: This dependence on published literature introduces the risk of publication bias, where studies with statistically significant or favorable results are more likely to be published. Failure to acknowledge and address publication bias can lead to overestimating the true effect size.
- Neglecting Study Quality: Including studies with poor methodological quality can bias the results of a meta-analysis leading to unreliable and inaccurate effect size estimates. The decision of which studies to include should be based on predefined eligibility criteria to ensure the quality and relevance of the synthesis.
- Fixation on Statistical Significance: Placing excessive emphasis on the statistical significance of an overall effect while neglecting its practical significance is a critical mistake in meta-analysis, as is the case in primary studies. Considers both statistical and clinical or substantive significance.
- Misinterpreting Significance Testing in Subgroup Analyses: When comparing effect sizes across subgroups, merely observing that an effect is statistically significant in one subgroup but not another is insufficient. Conduct formal tests of statistical significance for the difference in effects between subgroups or to calculate the difference in effects with confidence intervals.
- Ignoring Dependence: Neglecting dependence among effect sizes, particularly when multiple effect sizes are extracted from the same study, is a mistake. This oversight can inflate Type I error rates and lead to inaccurate estimations of average effect sizes and standard errors.
- Inadequate Reporting: Failing to transparently and comprehensively report the meta-analysis process is a crucial mistake. A meta-analysis should include a detailed written protocol outlining the research question, search strategy, inclusion criteria, and analytical methods.
Critical Evaluation
Meta-analysis is powerful, but it is also genuinely contested. A fair account has to set out both what the method gets right and the objections its own proponents take seriously.
Strengths
Done well, meta-analysis has real advantages over a single study or a narrative review.
- Statistical Power: pooling many studies and thousands of participants gives far greater power than any single study, so genuine but modest effects can be detected.
- Magnitude, Not Just Existence: it reports how large an effect is on a standardised scale, not merely whether it reached significance.
- Resolving Conflicts: when studies disagree, meta-analysis can show whether the results are genuinely contradictory or all compatible with one underlying effect blurred by sampling error.
- Transparency: a systematic search, pre-specified criteria, and explicit statistical combination make the process reproducible and auditable, unlike a narrative review.
- Generalisability: aggregating across many samples and settings lets a conclusion, especially under a random-effects model, generalise more securely than any single study.
Key Study: Smith and Glass (1977)
The study that established meta-analysis as a tool for psychology addressed one of the field’s most contested questions: does psychotherapy actually work?
- Aim: to resolve a long-running debate over whether psychotherapy works by quantitatively integrating the entire body of controlled outcome research, rather than relying on any single trial or a reviewer’s impression.
- Method: Smith and Glass located and coded 375 controlled studies of psychotherapy and counselling outcomes, each comparing a treated group with an untreated or differently treated control. They computed 833 effect sizes and examined whether the size of the effect varied with the type of therapy.
- Results: the average effect size was about 0.68 standard deviations, meaning the typical treated client was better off than roughly 75% of untreated controls. The effect was similarly sized across very different schools of therapy.
- Conclusion: pooled across hundreds of studies, psychotherapy produces a substantial and reliable benefit. The paper’s lasting importance was methodological: it showed a large, messy literature could be converted into one common effect-size metric and combined into a single, defensible estimate.
Limitations
Meta-analysis is genuinely contested, and a fair account must set out the objections its own proponents take seriously.
- Garbage In, Garbage Out: the pooled estimate can be no better than the studies it combines; averaging weak, biased studies produces a precise-looking but misleading result.
- The Apples-and-Oranges Problem: critics argue meta-analyses often combine studies that are too different in population, treatment, or design to be meaningfully averaged.
- Publication Bias: selective publication of significant results can inflate the pooled estimate, and the usual statistical corrections do not reliably fix it.
- Researcher Degrees of Freedom: many discretionary choices, made after glimpsing the results, create flexibility that can steer the conclusion toward what the analyst expects.
- Over-Reliance on a Single Number: a meta-analysis is often remembered as one headline figure, which can flatten genuine, important variation in the effect.
- Correlation Is Not Causation: pooling correlational studies yields a more precise correlation, not evidence of a causal effect.
Garbage In, Garbage Out
If the included studies are methodologically weak, poorly controlled, or biased in measurement, averaging them does not cancel out their flaws. It can produce a precise-looking but biased result.
That narrow interval can be deceptive.
It disguises how shaky the underlying evidence really is. This is why quality appraisal, using tools such as the Cochrane Risk of Bias Tool or the Newcastle-Ottawa Scale, is treated as inseparable from the method’s statistical side.
The Apples-and-Oranges Problem
Critics argue that meta-analyses often combine studies that are too different in population, treatment, measure, or design to be meaningfully averaged. The pooled effect, on this view, mixes things that should never have been added together.
Defenders disagree.
Combining apples and oranges is legitimate, they argue, if the real question is about fruit. Heterogeneity statistics and moderator analyses exist to detect and probe that diversity. Consider one example.
Bond and Smith’s (1996) meta-analysis of 133 Asch-type conformity studies shows the payoff. Pooling revealed conformity was reliably higher in collectivist than individualist cultures, a pattern no single study could show.
Not every mix is equally defensible.
Publication Bias
As the Kvarven, Strømland, and Johannesson (2020) study showed empirically (see Contemporary Research below), selective publication can inflate meta-analytic effects substantially. The standard statistical corrections for this bias are imperfect.
Funnel plots, Egger’s test, and trim-and-fill can detect and estimate the bias.
None of them removes its underlying cause. The more durable fix is structural: pre-registration, results-blind review, and trial registries that make the whole population of studies visible.
Researcher Degrees of Freedom
Meta-analysts make many consequential, discretionary decisions: which databases to search, where to draw inclusion and exclusion lines, how to code ambiguous studies, and which model and moderators to fit.
These choices can be made after glimpsing the results.
That creates flexibility that can be steered, consciously or not, toward a preferred conclusion, so two competent teams meta-analysing the very same question can reach genuinely different answers. This is a central reason pre-registering the protocol has become so important for a credible meta-analysis.
Contemporary Research
Recent work on meta-analysis has been reshaped by the replication crisis. Increasingly, the field treats a meta-analysis as an estimate whose trustworthiness must itself be checked, not as a final word.
- Aim: to test whether meta-analytic effect sizes in psychology are accurate, or whether publication bias and selective reporting systematically inflate them, and whether standard bias-correction techniques repair the damage.
- Method: the researchers identified 15 meta-analyses that addressed the same effects as 15 large-scale, pre-registered, multi-laboratory replication projects, whose pooled results are free of publication bias because every result is reported regardless of outcome. They compared each meta-analytic estimate against its “clean” replication estimate, and tested three established bias-correction methods to see whether these brought the meta-analytic estimates back into line.
- Results: the meta-analytic effect sizes were significantly larger than the replication estimates in 12 of the 15 pairs. On average, conventional meta-analyses reported effects almost three times as large as the bias-free replications, and the three correction methods did not fix the problem.
- Conclusion: meta-analyses of the published psychological literature can markedly overestimate true effect sizes, and routine corrections for publication bias are not reliable remedies. The finding strengthened the case for pre-registration and registered multi-site replication as the real safeguard, rather than any after-the-fact statistical patch.
Consistent with this, a re-appraisal of the widely-cited growth-mindset literature found a small average effect once heterogeneity and study quality were properly modelled (Macnamara & Burgoyne, 2022).
Both results point the same way. A meta-analysis’s headline number is only as trustworthy as the rigour behind it.
Real-Life Example
Brewin, C. R., Andrews, B., & Valentine, J. D. (2000). Meta-analysis of risk factors for posttraumatic stress disorder in trauma-exposed adults. Journal of Consulting and Clinical Psychology, 68(5), 748.
This meta-analysis of 77 articles examined risk factors for posttraumatic stress disorder (PTSD) in trauma-exposed adults, with sample sizes ranging from 1,149 to over 11,000. Several factors consistently predicted PTSD with small effect sizes (r = 0.10 to 0.19), including female gender, lower education, lower intelligence, previous trauma, childhood adversity, and psychiatric history. Factors occurring during or after trauma showed somewhat stronger effects (r = 0.23 to 0.40), including trauma severity, lack of social support, and additional life stress. Most risk factors did not predict PTSD uniformly across populations and study types, with only psychiatric history, childhood abuse, and family psychiatric history showing homogeneous effects. Notable differences emerged between military and civilian samples, and methodological factors influenced some risk factor effects. The authors concluded that identifying a universal set of pretrauma predictors is premature and called for more research to understand how vulnerability to PTSD varies across populations and contexts.
Bibliography
- Bar-Haim, Y., Lamy, D., Pergamin, L., Bakermans-Kranenburg, M. J., & Van Ijzendoorn, M. H. (2007). Threat-related attentional bias in anxious and nonanxious individuals: a meta-analytic study. Psychological bulletin, 133(1), 1.
- Bond, R., & Smith, P. B. (1996). Culture and conformity: A meta-analysis of studies using Asch’s (1952b, 1956) line judgment task. Psychological Bulletin, 119(1), 111-137.
- Borenstein, M., Hedges, L. V., Higgins, J. P., & Rothstein, H. R. (2021). Introduction to meta-analysis. John Wiley & Sons.
- Curtiss, J., & DiPietro, B. C. (2025). Machine learning in the prediction of treatment response for emotional disorders: A systematic review and meta-analysis. Clinical Psychology Review, 102593.
- Crits-Christoph, P. (1992). A Meta-analysis. American Journal of Psychiatry, 149, 151-158.
- Duval, S. J., & Tweedie, R. L. (2000). A nonparametric “trim and fill” method of accounting for publication bias in meta-analysis. Journal of the American Statistical Association, 95(449), 89–98.
- Egger, M., Davey Smith, G., Schneider, M., & Minder, C. (1997). Bias in meta-analysis detected by a simple, graphical test. BMJ, 315(7109), 629–634.
- Egger, M., Smith, G. D., & Phillips, A. N. (1997). Meta-analysis: principles and procedures. Bmj, 315(7121), 1533-1537.
- Field, A. P., & Gillett, R. (2010). How to do a meta‐analysis. British Journal of Mathematical and Statistical Psychology, 63(3), 665-694.
- Hedges, L. V., & Pigott, T. D. (2004). The power of statistical tests for moderators in meta-analysis. Psychological methods, 9(4), 426.
- Hedges, L. V., & Olkin, I. (2014). Statistical methods for meta-analysis. Academic press.
- Hofmann, S. G., Sawyer, A. T., Witt, A. A., & Oh, D. (2010). The effect of mindfulness-based therapy on anxiety and depression: A meta-analytic review. Journal of consulting and clinical psychology, 78(2), 169.
- Kvarven, A., Strømland, E., & Johannesson, M. (2020). Comparing meta-analyses and preregistered multiple-laboratory replication projects. Nature Human Behaviour, 4(4), 423-434.
- Littell, J. H., Corcoran, J., & Pillai, V. (2008). Systematic reviews and meta-analysis. Oxford University
Press. - Lyubomirsky, S., King, L., & Diener, E. (2005). The benefits of frequent positive affect: Does happiness lead to success?. Psychological bulletin, 131(6), 803.
- Macnamara, B. N., & Burgoyne, A. P. (2022). Do growth mindset interventions impact students’ academic achievement? A systematic review and meta-analysis with recommendations for best practices. Psychological Bulletin.
- Polanin, J. R., & Pigott, T. D. (2015). The use of meta‐analytic statistical significance testing. Research Synthesis Methods, 6(1), 63-73.
- Rodgers, M. A., & Pustejovsky, J. E. (2021). Evaluating meta-analytic methods to detect selective reporting in the presence of dependent effect sizes. Psychological methods, 26(2), 141.
- Rosenthal, R. (1991). Meta-analysis: a review. Psychosomatic medicine, 53(3), 247-271.
- Smith, M. L., & Glass, G. V. (1977). Meta-analysis of psychotherapy outcome studies. American Psychologist, 32(9), 752-760.
- Tipton, E., Pustejovsky, J. E., & Ahmadi, H. (2019). A history of meta‐regression: Technical, conceptual, and practical developments between 1974 and 2018. Research synthesis methods, 10(2), 161-179.
- Zhao, J. G., Zeng, X. T., Wang, J., & Liu, L. (2017). Association between calcium or vitamin D supplementation and fracture incidence in community-dwelling older adults: a systematic review and meta-analysis. Jama, 318(24), 2466-2482.