Correlation means association – more precisely, it measures the extent to which two variables are related. There are three possible results of a correlational study: a positive correlation, a negative correlation, and no correlation.
Types of Correlation
- Positive Correlation: relationship between two variables in which both variables move in the same direction. Therefore, one variable increases as the other variable increases, or one variable decreases while the other decreases. An example of a positive correlation would be height and weight. Taller people tend to be heavier.

- Negative Correlation: relationship between two variables in which an increase in one variable is associated with a decrease in the other. An example of a negative correlation would be the height above sea level and temperature. As you climb the mountain (increase in height), it gets colder (decrease in temperature).

- Zero Correlation: exists when there is no relationship between two variables. For example, there is no relationship between the amount of tea drunk and the level of intelligence.

Scatter Plots
A correlation can be expressed visually. This is done by drawing a scatter plot (also known as a scattergram, scatter graph, scatter chart, or scatter diagram).
A scatter plot is a graphical display that shows the relationship between two numerical variables, or co-variables. Each point marks one participant’s pair of scores.
The plot’s tilt and spread reveal both the direction and strength of the correlation.

When you draw a scatter plot, it doesn’t matter which variable goes on the x-axis and which goes on the y-axis.
Correlations always use paired scores. The values for both variables are plotted together to build the diagram.
Decide which variable goes on each axis, then mark a cross where the two values meet.
Uses of Correlations
Prediction
- If there is a relationship between two variables, we can make predictions about one from another.
- Occupational Success: Self-report personality tests demonstrate predictive validity when traits measured early in life (like conscientiousness) are shown to be significantly correlated with future job performance, occupational attainment, and even physical health and well-being.
- Academic Forecasting: Admissions test scores are used to predict university grades, just as baseline symptom severity can forecast how well therapy is likely to work.
Validity
- Concurrent Validity: Correlation between a new measure and an established measure administered at the same time. A new depression questionnaire, for example, should correlate highly with the established Beck Depression Inventory (BDI).
- Predictive Validity: Correlation between a test score and a later outcome. Admissions test scores predicting a student’s eventual degree grade is one common example, as is baseline symptom severity predicting therapy outcomes.
Reliability
- Test-Retest Reliability: If a psychological test (like a personality inventory) is reliable, a person taking it on a Tuesday should get a nearly identical score if they take it again on Friday. The correlation between the two sets of scores should be very high and positive.
- Inter-rater Reliability: When multiple professionals (like mental health diagnosticians or observational researchers) are assessing the same person or data, their judgments must be consistent. Ensuring that two different raters are in agreement is established by correlating their assessments.
Heritability: The Minnesota Twin Study
Correlation is also the core statistic behind behaviour genetics. Comparing correlations between different classes of relatives shows how much of a trait’s variation is genetic.
- Aim: To estimate the heritability of psychological traits by comparing identical (monozygotic) twins reared apart with twins reared together.
- Method: Bouchard and colleagues located over 100 pairs of adult twins separated in infancy and reunited each for about fifty hours of assessment. They correlated the twins’ scores on IQ, personality, and other measures (Bouchard et al., 1990).
- Results: Identical twins reared apart correlated around 0.75 on general cognitive ability, close to the 0.85 seen for twins reared together. Fraternal twins reared together correlated only around 0.40.
- Conclusion: Because identical twins reared apart share genes but not a rearing environment, their high correlation points to a strong genetic contribution to intelligence and personality.
The design cannot fully rule out shared prenatal or cultural factors the twins might still encounter. Even so, it remains one of psychology’s clearest correlational demonstrations of heritability.
Correlation Coefficients
Instead of drawing a scatter plot, a correlation can be expressed numerically as a coefficient ranging from -1 to +1, using Pearson’s r for continuous variables.

Correlation coefficients are standardized statistical measures used to quantify the strength and direction of the relationship between two variables.
The correlation coefficient (r) indicates the extent to which the pairs of numbers for these two variables lie on a straight line. Sign shows the direction. Values over zero indicate a positive correlation, while values under zero indicate a negative correlation.
A correlation of –1 indicates a perfect negative correlation, meaning that as one variable goes up, the other goes down. A correlation of +1 indicates a perfect positive correlation, meaning that as one variable goes up, the other goes up.
Spearman’s Rho for Ranked Data
Pearson’s r assumes both variables are measured on an interval scale and that their relationship is roughly a straight line. When a variable is ordinal, such as ranks or ratings, a different coefficient is needed.
Spearman’s rho is the answer. Denoted ρ or rₛ, it was introduced by the English psychologist Charles Spearman (1904) as part of his work on general intelligence. It works by converting each score to its rank within its own variable, then correlating the ranks.
Spearman’s ρ is useful in three situations. It suits data that are already ordinal, such as class rankings.
It also copes better than Pearson’s r with a curved but steadily rising relationship. And it blunts the effect of a single extreme outlier that would otherwise distort the coefficient.
Spearman’s ρ shares Pearson’s −1-to-+1 scale. It says nothing about causation either. Researchers often report both together as a check. When the two diverge sharply, it is a sign the scatter plot deserves a closer look.
Other Correlation Coefficients
Pearson’s r and Spearman’s ρ cover most cases, but three further coefficients suit more specialised data.
- Point-Biserial Correlation: Used when one variable is continuous and the other is a simple pass/fail type. It equals Pearson’s r with that variable coded 0 or 1.
- Phi Coefficient: Used when both variables are two-category, like compliance (yes/no) and a manipulated condition (yes/no); read directly from a 2×2 table.
- Kendall’s Tau: A rank-based coefficient comparing how often two observations are ordered consistently versus inconsistently. It is more conservative than Spearman’s ρ and suits small samples with many tied ranks.
Interpreting Effect Size: Cohen’s Guidelines
There is no single rule for what counts as a strong, moderate, or weak correlation. Interpretation depends on the field and what is being studied.
The most widely used benchmarks come from psychologist Jacob Cohen. Effect size is a standardised measure of how large a relationship is, independent of sample size. Cohen proposed treating an effect size of r ≈ 0.10 as small, r ≈ 0.30 as medium, and r ≈ 0.50 as large.
- Small effect (r ≈ 0.10): about 1% of the variance explained.
- Medium effect (r ≈ 0.30): about 9% of the variance explained.
- Large effect (r ≈ 0.50): about 25% of the variance explained.
Cohen intended these bands as a rough guide for planning studies, not fixed rules. More recent research has challenged them directly.
Funder and Ozer (2019) argue that Cohen’s benchmarks undervalue small correlations in personality and social psychology. Small effects still matter. A modest per-encounter effect, they note, can accumulate into something meaningful across repeated exposures.
Their re-analysis suggests r ≈ 0.10 is already a typical small effect in personality research, and r ≈ 0.30 is unusually large outside controlled experiments. The gap is striking.
A separate review of published correlations found that the 25th, 50th and 75th percentiles of reported effects sit at roughly 0.11, 0.19 and 0.29 (Gignac & Szodorai, 2016). Cohen’s “medium” band therefore already sits near the top of what researchers typically find.
How Correlation Compares to Regression
A correlation coefficient is symmetric: r stays the same whichever variable is treated as the outcome. Regression asks a more directional question instead.
Squaring the correlation gives r², the coefficient of determination: the share of variance in one variable that a straight-line relationship with the other explains. Regression puts this on the original scale, predicting an actual score for a new case instead of a bare coefficient.
Multiple regression goes further still. It can enter several predictors at once. Each variable’s own contribution then survives even after the others are held constant, which a single correlation coefficient cannot show on its own.
Correlation vs. Causation
Causation means that one variable (often called the predictor variable or independent variable) causes the other (often called the outcome variable or dependent variable).
Experiments can establish causation. An experiment isolates and manipulates the independent variable to observe its effect on the dependent variable. It also controls the environment to eliminate extraneous variables.
A correlation between variables does not automatically mean that one causes the other. It only shows that a relationship exists.
“Correlation is not causation” means that just because two variables are related it does not necessarily mean that one causes the other.
An experiment can predict cause and effect because it manipulates the independent variable directly. A correlation can only show a relationship, since an unknown extraneous variable may still explain it.
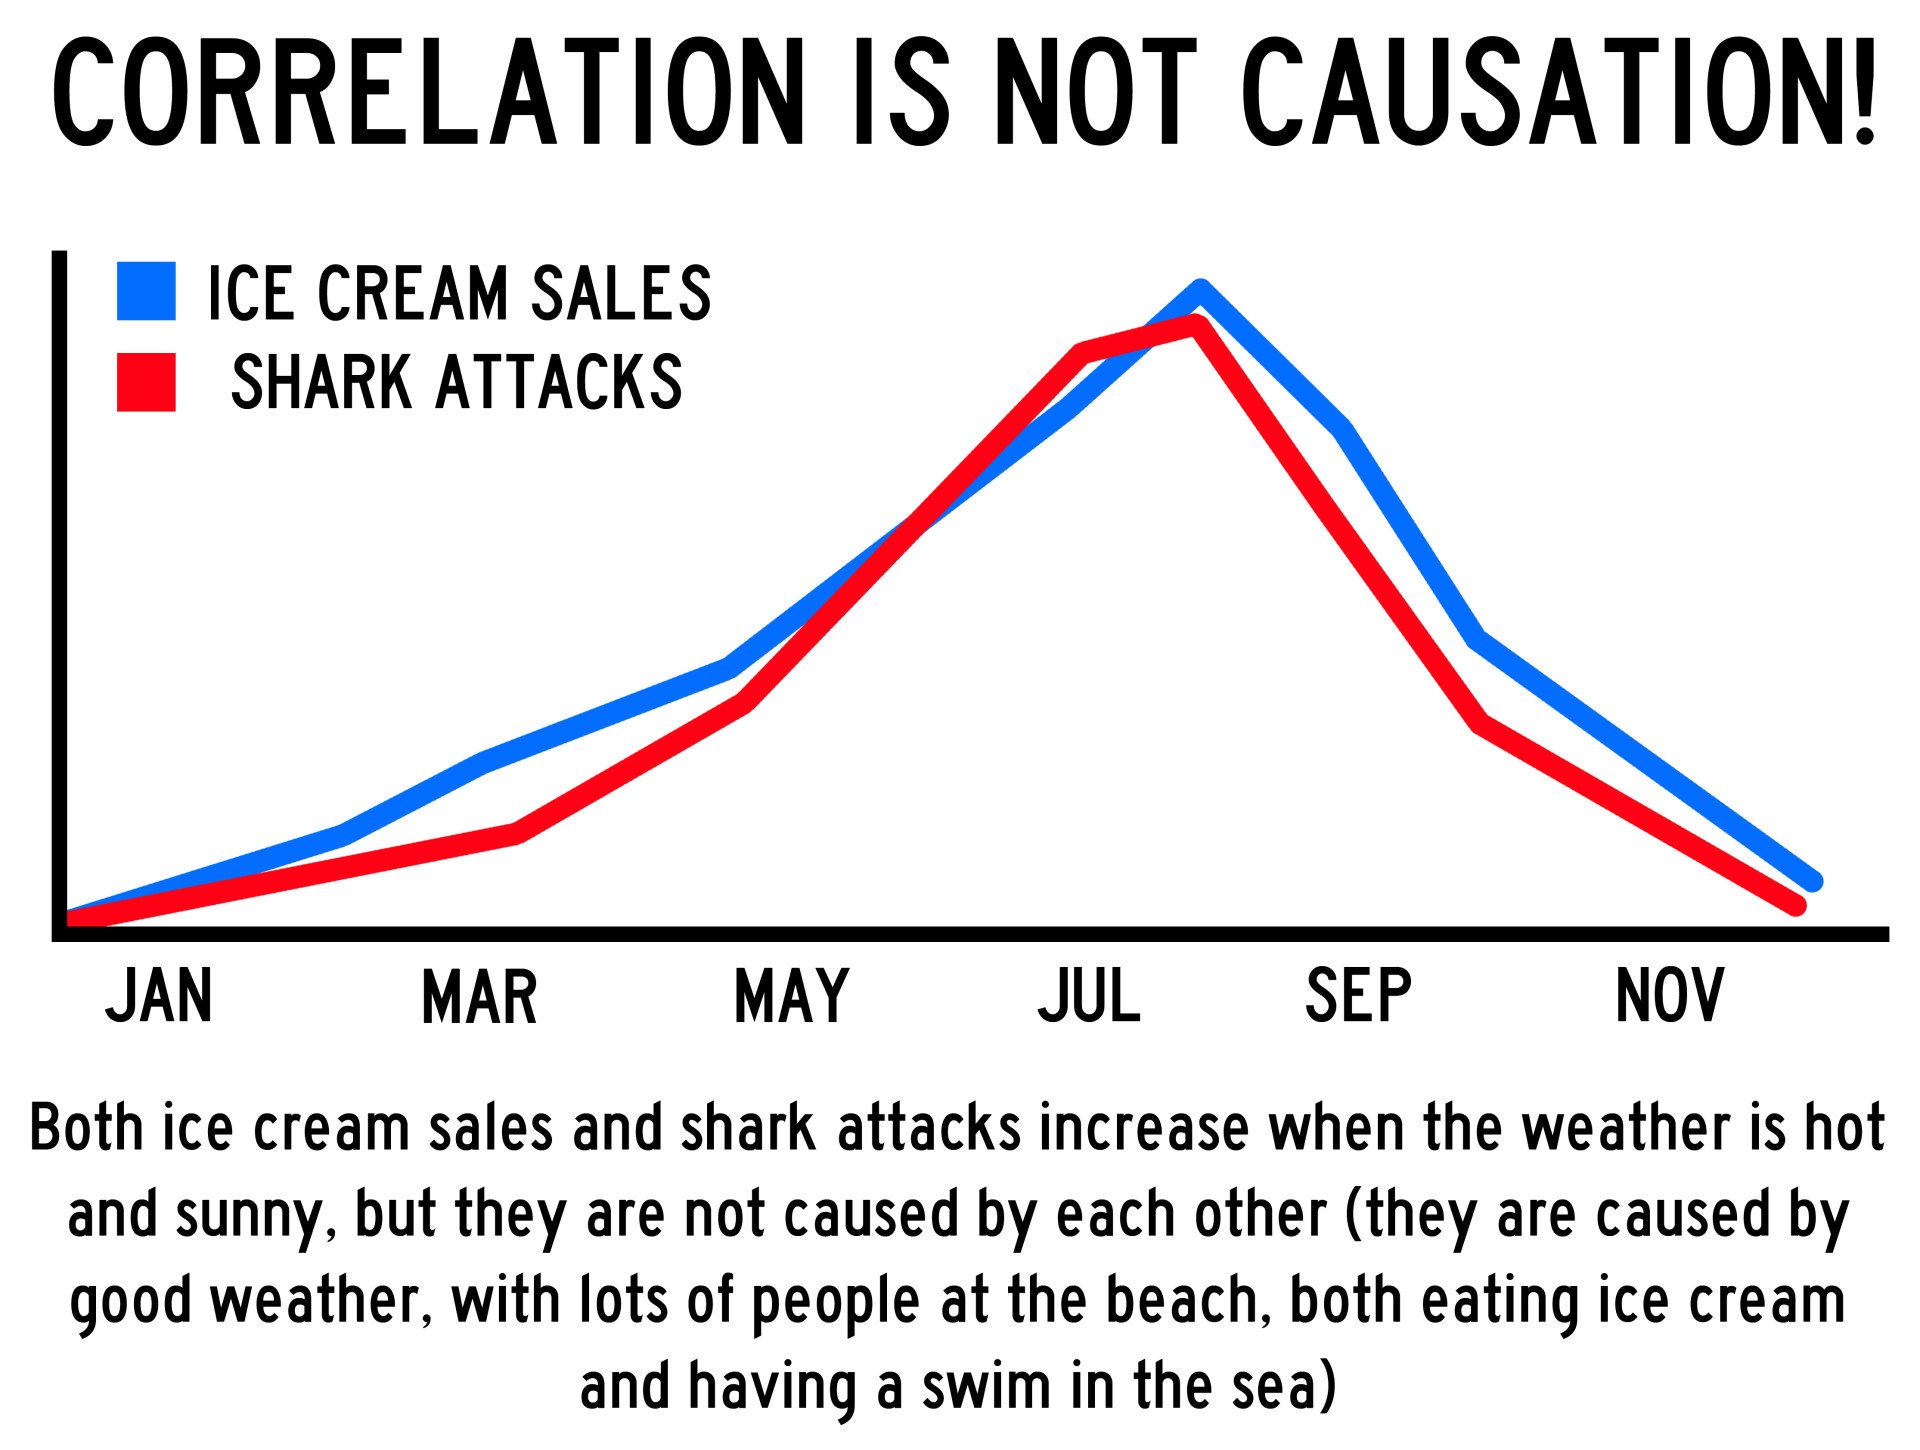

Third-Variable Problem
Variables are sometimes correlated because one causes the other. But often some other factor, a confounding variable, is actually driving the systematic movement in both.
This is called the third-variable problem: two variables appear systematically related, but no direct causal link connects them. No cause runs between them at all. Instead, an unseen or unmeasured third variable is independently influencing both, creating the illusion of a direct connection.
For example, being a patient in a hospital is correlated with dying. This does not mean one event causes the other, since a third variable, such as diet or exercise levels, might be involved.
Confounds like this are common. This problem is the primary reason why researchers constantly emphasize that correlation does not imply causation.
Even when cause and effect seems intuitive, a correlational study cannot rule out a confounding third variable behind the pattern.
Examples of the third-variable problem
To understand how deceptive this can be, consider these examples from the sources:
- Ice Cream and Crime: Ice cream sales and crime rates rise together, but ice cream does not cause crime. Warm weather drives both, drawing people outdoors to buy treats and interact more.
- Spa Salons and Criminals: Cities with more spa salons also tend to have more criminals. City size explains this: a larger population naturally means more of both.
- Breast Implants and Suicide: Breast implants correlate with suicide, but implants do not cause it. Low self-esteem may independently drive both cosmetic surgery and suicide risk.
- TV Violence and Aggression: Children who watch violent television tend to be more aggressive. Neglectful parenting may explain both, since unsupervised children watch more violent TV and go uncorrected.
- Generosity and Happiness: Spending on others correlates with happiness, but wealth may be the real cause, enabling both greater generosity and greater happiness.
How researchers handle the third-variable problem
Because correlational studies cannot use experimental manipulation to completely isolate variables, researchers must be proactive to ensure their findings are credible.
The best way to combat the third-variable problem is to anticipate potential confounding variables in advance and include them in the research study.
By actively measuring these third variables, researchers can use advanced statistical techniques such as partial correlations. This lets them mathematically “remove” or hold constant the third variable’s effect.
If the correlation survives after the third variable is factored out, researchers gain more confidence the relationship is genuine and not spurious.
Simpson’s Paradox and the Ecological Fallacy
Two further problems complicate a correlational finding beyond the usual third-variable warning.
Simpson’s paradox is when a correlation seen across a whole sample reverses once the sample is split by a third variable.
In the 1973 Berkeley admissions data, men were admitted at a higher overall rate, yet women did as well or better within almost every department (Simpson, 1951). Women had simply applied to more competitive departments.
The ecological fallacy is different: a correlation found at the level of groups, such as countries or schools, does not automatically hold for the individuals inside them. A country-level link between chocolate consumption and Nobel prizes says nothing about any one chocolate-eating person’s own odds.
Strengths of Correlational Research
Correlational research offers several unique advantages that make it an indispensable tool, particularly when exploring complex or naturally occurring phenomena.
- Studying Unmanipulable or Unethical Variables: Correlational methods let researchers study variables that cannot ethically or practically be manipulated, such as trauma, stress, or genetics, as in twin and adoption studies.
- Predictive Value: A strong correlation lets researchers predict one variable from another. Universities use SAT scores to predict college GPA, for example.
- Numerical and Comparable Data: Correlational studies yield a standardized coefficient, such as Pearson’s r, ranging from -1 to +1. This makes relationships easy to interpret and compare across studies.
- Foundation for Future Research: A strong correlation can generate new hypotheses, which researchers then test using more controlled experimental methods.
- Ecological Validity: Correlational studies often observe behavior as it naturally occurs, capturing real-world attitudes more authentically than lab experiments can.
Limitations of Correlational Research
Despite its usefulness, correlational research carries significant methodological limitations that restrict how the data can be interpreted.
- Inability to Establish Causation: Correlational research cannot prove cause and effect, only that variables change together. We cannot know whether violent television causes aggression, or aggressive children simply watch more of it.
- The Third-Variable Problem: As explained above, an apparent correlation can vanish once a hidden third variable, like city size, is accounted for.
- Failure to Capture Curvilinear Relationships: Correlation coefficients measure only linear relationships. A true U-shaped pattern, such as the Yerkes–Dodson law relating arousal to performance, can return a coefficient near zero.
- Spurious Correlations: Testing many variables raises the chance some correlations appear significant purely by chance. Reporting only these “significant” findings promotes false patterns.
- Lack of Explanatory Depth: A correlation shows that a relationship exists but not why. Self-report data is also vulnerable to social desirability bias and limited self-insight.
FAQs
How do you know if a study is correlational?
A study is considered correlational if it examines the relationship between two or more variables without manipulating them.
In other words, the study does not involve the manipulation of an independent variable to see how it affects a dependent variable.
One way to identify a correlational study is to look for language that suggests a relationship between variables rather than cause and effect.
Watch for relationship language.
For example, the study may use phrases like associated with, related to, when describing the variables being studied.
Another way to identify a correlational study is to look for information about how the variables were measured. Measurement method is the clue. Correlational studies typically involve measuring variables using self-report surveys, questionnaires, or other measures of naturally occurring behavior.
Finally, a correlational study may include statistical analyses such as correlation coefficients or regression analyses to examine the strength and direction of the relationship between variables.
Why is a correlational study used?
Correlational studies are particularly useful when it is not possible or ethical to manipulate one of the variables.
For example, it would not be ethical to manipulate someone’s age or gender. However, researchers may still want to understand how these variables relate to outcomes such as health or behavior. Ethics limits the options.
Additionally, correlational studies can be used to generate hypotheses and guide further research.
If a correlational study finds a significant relationship between two variables, this can suggest a possible causal relationship that can be further explored in future research.
What is the goal of correlational research?
The ultimate goal of correlational research is to increase our understanding of how different variables are related and to identify patterns in those relationships.
This information can then be used to generate hypotheses and guide further research aimed at establishing causality.
Correlational designs matter most when a variable cannot be manipulated for ethical or practical reasons, such as trauma exposure or genetic background.
Example Correlation Studies
Vanderhasselt, M. A., Vergauwe, R., Baeken, C., Pulopulos, M. M., & De Raedt, R. (2025). Better together: The importance of brain health in the relationship between stress regulation, social connection and lifestyle in promoting mental health and well-being. Clinical Psychology Review, 102611.

Key Takeaways
- Association, Not Causation: A correlation only shows two variables are related. It cannot say one causes the other.
- Three Outcomes: A correlation is positive (both variables rise together), negative (one rises as the other falls), or zero (no relationship).
- Pearson’s r: The standard coefficient for continuous data, ranging from -1 to +1, where values near either end show a strong relationship.
- Spearman’s Rho: Used instead of Pearson’s r for ranked or ordinal data, or when outliers distort the coefficient.
- Effect Size: Cohen’s guidelines treat r ≈ 0.10 as small, 0.30 as medium, and 0.50 as large, though modern research suggests these bands undervalue small effects.
- Third Variables: An apparent correlation can vanish once a hidden confounding variable, like city size or warm weather, is accounted for.
- Scatter Plots: Always inspect the scatter plot alongside the coefficient. It reveals outliers and curved relationships a coefficient alone can hide.
References
Bouchard, T. J., Lykken, D. T., McGue, M., Segal, N. L., & Tellegen, A. (1990). Sources of human psychological differences: The Minnesota Study of Twins Reared Apart. Science, 250(4978), 223–228. https://doi.org/10.1126/science.2218526
Cohen, J. (1988). Statistical power analysis for the behavioral sciences (2nd ed.). Lawrence Erlbaum.
Cohen, J. (1992). A power primer. Psychological Bulletin, 112(1), 155–159. https://doi.org/10.1037/0033-2909.112.1.155
Funder, D. C., & Ozer, D. J. (2019). Evaluating effect size in psychological research: Sense and nonsense. Advances in Methods and Practices in Psychological Science, 2(2), 156–168. https://doi.org/10.1177/2515245919847202
Gignac, G. E., & Szodorai, E. T. (2016). Effect size guidelines for individual differences researchers. Personality and Individual Differences, 102, 74–78. https://doi.org/10.1016/j.paid.2016.06.069
Simpson, E. H. (1951). The interpretation of interaction in contingency tables. Journal of the Royal Statistical Society: Series B (Methodological), 13(2), 238–241. https://doi.org/10.1111/j.2517-6161.1951.tb00088.x
Spearman, C. (1904). The proof and measurement of association between two things. The American Journal of Psychology, 15(1), 72–101. https://doi.org/10.2307/1412159
Yerkes, R. M., & Dodson, J. D. (1908). The relation of strength of stimulus to rapidity of habit-formation. Journal of Comparative Neurology and Psychology, 18(5), 459–482. https://doi.org/10.1002/cne.920180503