5-minute checks
Pick one part of Research Methods. Five quick questions, an explanation after each answer, and a link to the notes for anything you miss. Each try gives you new questions.
Research Methods · 5-minute check
Hypotheses, sampling and ethics
Aims, directional and non-directional hypotheses, operationalisation, sampling techniques and ethical issues
1. Which statement best describes the difference between an aim and a hypothesis? [1 mark]
2. Which of the following is a directional (one-tailed) hypothesis? [1 mark]
3. Which of the following is a non-directional (two-tailed) hypothesis? [1 mark]
4. A researcher is investigating a behaviour for which all previous studies have found a clear, consistent direction of effect. Which type of hypothesis is most appropriate? [1 mark]
5. Why must the variables in a hypothesis be operationalised? [1 mark]
6. Which of these is the clearest example of a fully operationalised hypothesis? [1 mark]
7. Which sampling method gives every member of the target population an equal chance of being selected? [1 mark]
8. A researcher places an advert on a noticeboard and uses the people who reply to take part in the study. Which sampling method is this? [1 mark]
9. A researcher takes a list of all 200 employees in a company and selects every 10th person on the list. Which sampling method is this? [1 mark]
10. Which sampling method is most likely to produce a sample that closely reflects the proportions of subgroups in the target population? [1 mark]
11. Which of the following is the main strength of opportunity sampling? [1 mark]
12. Which sampling method is most likely to produce an unrepresentative sample because only highly motivated or unusual people tend to put themselves forward? [1 mark]
13. The BPS code of ethics focuses on four primary ethical principles. Which of the following is one of them? [1 mark]
14. A researcher wants participants to take part in an experiment but cannot reveal the true aim in advance without affecting their behaviour. To deal with the consent issue, the researcher asks a similar group of people whether they would agree to take part if they were deceived in this way. Which technique is this? [1 mark]
15. Which way of dealing with ethical issues is used at the END of a study to reveal the true aims, return participants to their pre-study state, and offer the right to withdraw their data? [1 mark]
16. An ethics committee weighs the value of a study's findings against any potential distress or risk to participants before approving it. What is this judgement called? [1 mark]
17. Which statement about confidentiality and anonymity is correct? [1 mark]
18. When should a directional (one-tailed) hypothesis be used? [1 mark]
19. Which ethical principle requires researchers to inform participants about the true nature of a study after it has taken place? [1 mark]
20. Which two of the following are reasons why a non-directional hypothesis might be used? [1 mark]
(Select all that apply)
Scoring your answers…
Research Methods · 5-minute check
Experiments and design
Variables, investigator effects, experimental designs, types of experiment and pilot studies
1. A researcher investigates whether people recall more words in a silent room than in a noisy room, setting up the experiment in a sound-proofed university laboratory. Which type of experiment is this? [1 mark]
2. A researcher compares stress levels of residents before and after a real earthquake strikes their town. The IV (earthquake/no earthquake) was not manipulated by the researcher. Which type of experiment is this? [1 mark]
3. A researcher compares the reaction times of left-handed and right-handed people. Because handedness is a pre-existing characteristic that cannot be manipulated, this study is best described as a: [1 mark]
4. In a study testing whether background music affects how quickly people complete a crossword, what is the dependent variable? [1 mark]
5. Which of the following is the best example of an investigator effect? [1 mark]
6. A researcher tests the same 20 participants under both a 'quiet' and a 'noisy' condition. Which experimental design is being used? [1 mark]
7. Which control method is used specifically to deal with order effects? [1 mark]
8. A researcher uses two separate groups of participants but first pairs each person in one group with a similar person in the other on age and IQ. This is a: [1 mark]
9. What is the main purpose of conducting a pilot study before the main investigation? [1 mark]
10. Which technique controls participant variables in an independent groups design? [1 mark]
11. Which type of experiment involves the researcher manipulating the independent variable in a controlled, artificial setting? [1 mark]
12. Which experimental design uses the same participants in both conditions of the experiment? [1 mark]
13. A variable that changes systematically with the independent variable and could provide an alternative explanation for the results is called a: [1 mark]
14. What term describes cues in a research study that allow participants to guess the aim and alter their behaviour accordingly? [1 mark]
15. Which two of the following are features of a laboratory experiment? [1 mark]
(Select all that apply)
16. Which two of the following are advantages of using a repeated measures design? [1 mark]
(Select all that apply)
Scoring your answers…
Research Methods · 5-minute check
Non-experimental methods
Case studies, correlations, interviews, questionnaires, observations and content analysis
1. A researcher sits unseen behind a one-way mirror in a nursery and, without the children knowing, ticks a box every time a child shares a toy. Which TWO features best describe this observation? [1 mark]
2. An observer watches a playground and, every 20 seconds, records what one target child is doing at that exact moment. Which sampling method is being used? [1 mark]
3. Which of the following is the best example of an operationalised behavioural category for recording aggression? [1 mark]
4. Which type of observation typically allows the LEAST control over extraneous variables but produces behaviour high in ecological validity? [1 mark]
5. Which feature best defines a structured interview? [1 mark]
6. A researcher wants data that is quick and easy to analyse statistically and to compare between respondents. Which type of question should they use? [1 mark]
7. Which of the following is a strength specifically of OPEN questions over closed questions? [1 mark]
8. Which interview type combines a core list of pre-set questions with the freedom to ask unplanned follow-up questions? [1 mark]
9. A researcher records the temperature and the number of ice creams sold each day, without manipulating either variable. Which research method is being used? [1 mark]
10. On a scattergram, the data points form a clear pattern running from the bottom-left to the top-right of the graph. What does this show? [1 mark]
11. A study finds that as one co-variable increases, the other decreases. What is this called? [1 mark]
12. Which statement correctly describes a key difference between a correlation and an experiment? [1 mark]
13. A correlation is found between ice cream sales and drowning incidents. Why can we NOT conclude that buying ice cream causes drowning? [1 mark]
14. On a scattergram, the data points are scattered randomly with no clear pattern or line. What does this indicate? [1 mark]
15. Which of the following is NOT a possible type of correlation that can be found between two co-variables? [1 mark]
16. In content analysis, what does 'coding' refer to? [1 mark]
17. Which of the following is a strength of content analysis? [1 mark]
18. Which of the following is a limitation of content analysis? [1 mark]
19. A researcher counts how often male and female characters are shown in caring roles across a sample of children's books. Which research method is being used? [1 mark]
20. Coding in content analysis transforms the material into which type of data? [1 mark]
21. Which research method is best described as an in-depth investigation of a single individual or small group, usually over time, using multiple techniques? [1 mark]
22. What type of data does a case study most typically produce? [1 mark]
23. Which of the following is a key LIMITATION of using a case study? [1 mark]
24. Which of the following is a key STRENGTH of the case study method? [1 mark]
25. A researcher gathers data by asking a person to describe their childhood experiences from memory. This reliance on past recall makes the case study: [1 mark]
26. Which combination of techniques would most typically be used within a single case study? [1 mark]
Scoring your answers…
Research Methods · 5-minute check
Reliability, validity and science
Reliability, types of validity, peer review, features of science and reporting investigations
1. What is the main purpose of peer review in psychology? [1 mark]
2. Which of these is NOT one of the recognised purposes of peer review? [1 mark]
3. A reviewer judging a submitted article is most likely to be: [1 mark]
4. Which outcome of peer review means the work cannot be submitted again? [1 mark]
5. How does effective psychological research into mental-health treatment most directly benefit the economy? [1 mark]
6. Which statistical concept is used to quantify reliability when comparing two sets of scores from a test-retest or two observers' records? [1 mark]
7. Which method of measuring reliability involves giving the SAME test to the SAME people on a later occasion and comparing the results? [1 mark]
8. A correlation coefficient of which value would normally be accepted as showing that a measure is reliable? [1 mark]
9. Two observers watch the same children at play and their tallies of 'aggressive acts' correlate at +0.45. What does this most likely indicate? [1 mark]
10. Which of the following is the BEST way to improve the reliability of an observational study? [1 mark]
11. A psychologist gives the same IQ test to the same people two weeks apart and the scores correlate at +0.85. What has been demonstrated? [1 mark]
12. A researcher worries that her 1970s findings on conformity may no longer apply to people living today. Which type of validity is she questioning? [1 mark]
13. A psychologist correlates scores on a new depression questionnaire with scores on a well-established depression inventory and finds they agree closely. This demonstrates: [1 mark]
14. Which of the following is concerned with whether the independent variable (and not an extraneous variable) caused the change in the dependent variable? [1 mark]
15. Glancing over a new questionnaire and judging that it 'looks like' it measures anxiety is an example of checking which type of validity? [1 mark]
16. Which technique is specifically used within a questionnaire to detect socially desirable or untruthful answering and so help establish validity? [1 mark]
17. Which feature of science refers to the extent to which a study's procedures and findings can be repeated by other researchers? [1 mark]
18. According to Popper, what must a theory be capable of in order to be considered scientific? [1 mark]
19. Which term describes a set of shared assumptions, methods and terminology within a scientific discipline? [1 mark]
20. A researcher records behaviour using direct, unbiased observation and measurement rather than personal opinion. Which feature of science does this best illustrate? [1 mark]
21. Deriving a specific, testable hypothesis from an existing theory is an example of which form of reasoning? [1 mark]
22. Which of the following best describes a paradigm shift? [1 mark]
23. Which section of a scientific report should contain enough procedural detail for another researcher to replicate the study exactly? [1 mark]
24. In which section would a researcher state the aims and hypotheses of the investigation? [1 mark]
25. A psychologist wants to find the calculated value of their statistical test, the critical value, and whether the result was significant. Which section reports these? [1 mark]
26. Which piece of information would NOT normally be included in a journal reference for a cited article? [1 mark]
27. Where in a report should the limitations of the study and suggestions for improvement be discussed? [1 mark]
Scoring your answers…
Research Methods · 5-minute check
Data and descriptive statistics
Types of data, meta-analysis, levels of measurement, measures of central tendency, graphs and distributions
1. A researcher records the number of times each child shares a toy during a play session, producing a tally for each behavioural category. What type of data is this? [1 mark]
2. A psychologist analyses crime statistics published by the government in order to investigate a trend. In terms of who collected it, this is an example of: [1 mark]
3. Which of the following best describes qualitative data? [1 mark]
4. What is the defining feature of a meta-analysis? [1 mark]
5. A researcher gives participants a questionnaire with the open question 'Describe how your job makes you feel.' The responses are most likely to be: [1 mark]
6. Which option correctly distinguishes primary from secondary data? [1 mark]
7. A researcher records the data set: 10, 20, 30, 40, 100. Which statement best explains why the median (30) is more representative than the mean (40)? [1 mark]
8. Which measure of central tendency is most appropriate for nominal (categorical) data, such as the number of people who prefer tea, coffee or water? [1 mark]
9. What is the median of the data set 4, 6, 8, 10? [1 mark]
10. Which type of graph is the appropriate way to display data from a correlational study? [1 mark]
11. A researcher records the number of participants who chose each of four different ice-cream flavours (discrete categories). Which display is most appropriate? [1 mark]
12. In a positively skewed distribution, which is the correct ranking of the measures of central tendency? [1 mark]
13. In a negatively skewed distribution, which is the correct ranking of the measures of central tendency? [1 mark]
14. Which statement best describes a normal distribution? [1 mark]
15. A frequency distribution has a long tail pointing towards the LOWER scores on the left. This distribution is: [1 mark]
16. A researcher records whether participants are left-handed or right-handed and counts how many fall into each group. What level of measurement is this? [1 mark]
17. A psychologist times how long, in seconds, each participant takes to solve a puzzle. What level of measurement is this? [1 mark]
18. Participants rate their happiness on a scale from 1 ('not at all happy') to 5 ('very happy'). How should this data normally be treated? [1 mark]
19. Which feature is true of a histogram but NOT of a bar chart? [1 mark]
20. Which type of graph would be most appropriate for displaying continuous data such as reaction times grouped into equal time intervals? [1 mark]
21. Data collected by placing responses into named categories (such as "yes" or "no") is known as: [1 mark]
22. Which measure of central tendency is most affected by extreme scores (outliers)? [1 mark]
23. What does a standard deviation measure? [1 mark]
24. Which two of the following are examples of nominal data? [1 mark]
(Select all that apply)
Scoring your answers…
Research Methods · 5-minute check
Correlation coefficients and statistical tests
Correlation coefficients, probability and significance, Type I and II errors, the sign test and choosing a test
1. Which combination of criteria indicates that the sign test is the correct test to use? [1 mark]
2. A researcher records only whether each participant's mood score went UP or DOWN after an intervention, keeping no precise scores. Which feature of this data makes the sign test suitable? [1 mark]
3. In a sign test, 9 participants show a '+' difference, 3 show a '-' difference, and 2 show no change. What is the calculated value of S? [1 mark]
4. Continuing the previous study: 9 plus, 3 minus and 2 no-change. After discarding the zero-difference participants, what is the value of N used to find the critical value? [1 mark]
5. A sign test gives a calculated S of 2, and the critical value for that N at p≤0.05 is 2. What should the researcher conclude? [1 mark]
6. Which of these would make the sign test the WRONG choice of inferential test? [1 mark]
7. Which correlation coefficient indicates the STRONGEST relationship between two co-variables? [1 mark]
8. A researcher reports a correlation coefficient of -0.76. How should this be interpreted? [1 mark]
9. Which value is a possible correlation coefficient? [1 mark]
10. Two coefficients are reported: r = +0.40 and r = -0.65. Which statement is correct? [1 mark]
11. Which significance level is conventionally used in psychological research? [1 mark]
12. Why might a researcher choose the more stringent significance level of p ≤ 0.01 instead of p ≤ 0.05? [1 mark]
13. What does a significance level of p ≤ 0.05 represent? [1 mark]
14. Using a significance level that is too lenient (e.g. p <= 0.10) makes which error MORE likely? [1 mark]
15. Using a significance level that is too stringent (e.g. p <= 0.01) makes which error MORE likely? [1 mark]
16. Why can psychologists never be 100% certain that a significant result is not due to chance? [1 mark]
17. To look up the correct critical value in a statistical table, which THREE pieces of information are needed? [1 mark]
18. A researcher has nominal data from an independent groups design and wants to test for an association. Which test should they use? [1 mark]
19. A researcher has ordinal data from a repeated measures design and wants to test for a difference. Which test should they use? [1 mark]
20. A researcher has interval data from an independent groups design and wants to test for a difference. Which test should they use? [1 mark]
21. Which two pieces of information must a researcher establish to choose an appropriate inferential statistical test? [1 mark]
22. Which test is used to test a correlation between two co-variables measured at the interval level? [1 mark]
23. A correlation coefficient of −0.85 indicates: [1 mark]
Scoring your answers…
Research Methods Exam
Test your knowledge of AQA A-level Psychology Paper 2, Section C: Research Methods. Covers experimental methods, scientific processes, data handling, and inferential testing.
1. Which type of experiment involves the researcher manipulating the independent variable in a controlled, artificial setting? [1 mark]
2. Which experimental design uses the same participants in both conditions of the experiment? [1 mark]
3. Which sampling method gives every member of the target population an equal chance of being selected? [1 mark]
4. A variable that changes systematically with the independent variable and could provide an alternative explanation for the results is called a: [1 mark]
5. When should a directional (one-tailed) hypothesis be used? [1 mark]
6. What is the main purpose of conducting a pilot study? [1 mark]
7. What term describes cues in a research study that allow participants to guess the aim and alter their behaviour accordingly? [1 mark]
8. Which ethical principle requires researchers to inform participants about the true nature of a study after it has taken place? [1 mark]
9. Data collected by placing responses into named categories (such as "yes" or "no") is known as: [1 mark]
10. Which measure of central tendency is most affected by extreme scores (outliers)? [1 mark]
11. What does a standard deviation measure? [1 mark]
12. A correlation coefficient of −0.85 indicates: [1 mark]
13. Which two of the following are features of a laboratory experiment? [2 marks]
(Select all that apply)
14. Which two of the following are advantages of using a repeated measures design? [2 marks]
(Select all that apply)
15. Which two of the following are examples of nominal data? [2 marks]
(Select all that apply)
16. Which two of the following are reasons why a non-directional hypothesis might be used? [2 marks]
(Select all that apply)
17. Explain one strength and one limitation of using a laboratory experiment. [4 marks]
Model Answer
One strength of laboratory experiments is the high level of control over extraneous variables. Because the study takes place in a controlled, artificial environment, the researcher can ensure that only the independent variable changes between conditions while everything else is kept constant. This means that any change in the dependent variable can be attributed to the manipulation of the independent variable, allowing the researcher to establish a cause-and-effect relationship. For example, in a memory experiment conducted in a lab, the researcher can control factors such as noise, lighting, and temperature, ensuring these do not confound the results.
One limitation is that laboratory experiments often lack ecological validity. Because the setting is artificial and the tasks may not reflect real-world behaviour, findings may not generalise to everyday life. Participants may also be aware they are being studied and change their behaviour as a result (demand characteristics). For example, memorising lists of nonsense syllables in a laboratory tells us little about how memory works in real-world situations, such as remembering a conversation or a shopping list.
Mark Scheme
AO1 (2 marks): One strength clearly outlined with elaboration (e.g., high control of extraneous variables, ability to establish cause and effect, replicability). One limitation clearly outlined with elaboration (e.g., low ecological validity, demand characteristics, artificial setting).
AO3 (2 marks): Effective explanation of why the identified features are strengths/limitations, with appropriate examples or reasoning.
18. Explain what is meant by reliability and describe how reliability could be assessed in a psychological study. [4 marks]
Model Answer
Reliability refers to the consistency of a measure. A measurement is reliable if it produces the same or similar results each time it is used under the same conditions. If a test or method is not reliable, the results cannot be trusted and the research lacks credibility.
One way to assess reliability is through test-retest reliability. The same test or measure is administered to the same group of participants on two separate occasions, with a suitable time gap in between (long enough to prevent practice effects but short enough that the thing being measured has not genuinely changed). The two sets of scores are then correlated. A strong positive correlation (e.g., r = +0.80 or above) indicates that the measure produces consistent results over time and therefore has good test-retest reliability.
Another way is inter-observer reliability, which is used when two or more observers are recording behaviour (e.g., in an observational study). Both observers independently record behaviour using the same coding system. Their records are then correlated. A strong positive correlation suggests the behavioural categories are clear and unambiguous, meaning the observations are consistent and reliable.
Mark Scheme
AO1 (2 marks): Clear definition of reliability (consistency of measurement) and identification of at least one method of assessing it (e.g., test-retest, inter-observer reliability).
AO2 (2 marks): Description of how the method would be applied in practice, including relevant procedural detail (e.g., administering twice, correlating scores, what constitutes acceptable reliability).
19. Discuss the use of the sign test. Explain when it is appropriate to use the sign test and describe how the test is carried out. [6 marks]
Model Answer
The sign test is a non-parametric inferential statistical test used to determine whether a difference between two conditions is statistically significant or likely to have occurred by chance. It is the simplest inferential test and is the only one students are required to calculate at AS level.
The sign test is appropriate when three conditions are met. First, the study must be looking for a difference between two conditions rather than a correlation (i.e., the hypothesis predicts a difference). Second, the experimental design must be related — either repeated measures (the same participants in both conditions) or matched pairs (participants matched on key variables). Third, the data must be at least nominal level, meaning it can be placed into categories.
To carry out the sign test, the researcher first records each participant’s scores in both conditions. For each participant, the difference between the two scores is calculated, and a positive sign (+) or negative sign (−) is assigned depending on the direction of the difference. If a participant scores the same in both conditions (a zero difference), that participant is removed from the analysis and the value of N (the number of participants) is reduced accordingly.
Next, the researcher counts the number of positive signs and the number of negative signs. The less frequent sign is identified, and this count becomes the calculated value of S. This value of S is then compared to a critical value from a sign test table at the chosen significance level (usually p ≤ 0.05). For the result to be significant, the calculated value of S must be equal to or less than the critical value. If it is, the null hypothesis is rejected and the researcher concludes that the difference between the two conditions is statistically significant.
For example, if 12 participants took part, one had a tied score (so N = 11), and 3 showed a decrease while 8 showed an increase, S = 3 (the less frequent sign). This would be compared to the critical value for N = 11 at p ≤ 0.05.
Mark Scheme
AO1 (3 marks): Clear description of the sign test including: what it tests (difference), when to use it (related design, nominal data, test of difference), and the steps involved (calculate differences, assign signs, find S, compare to critical value).
AO3 (3 marks): Discussion of the test’s use, which may include: its simplicity, the conditions under which it is appropriate, limitations (e.g., loses detailed information by reducing data to signs), or comparison with more powerful tests. Credit appropriate examples.
20. Outline and evaluate the use of random sampling and opportunity sampling. Discuss the strengths and limitations of each. [6 marks]
Model Answer
Random sampling is a method where every member of the target population has an equal chance of being selected to participate. To carry out random sampling, the researcher obtains a complete list of all members of the target population, assigns each person a number, and then uses a random method (such as a random number generator or drawing numbers from a hat) to select the required number of participants.
A strength of random sampling is that it is the most unbiased method because every member has an equal chance of selection, making the sample more likely to be representative of the target population. This means the results are more generalisable. However, a limitation is that it requires access to a complete list of the target population, which is often impractical. It is also time-consuming, and even with random selection, the sample is not guaranteed to be representative — by chance, certain groups may be over- or under-represented.
Opportunity sampling involves selecting participants who are readily available and willing to take part at the time and place of the study. For example, a researcher might approach people in a university campus or shopping centre and ask them to participate.
A strength of opportunity sampling is that it is the easiest and most practical method to use. It is quick, convenient, and requires minimal planning, making it the most commonly used sampling method in psychological research. However, a significant limitation is that it is highly likely to produce a biased, unrepresentative sample because the researcher can only approach people who are available in a specific location at a specific time. This means the sample is unlikely to reflect the diversity of the target population, reducing the generalisability of the findings. For instance, sampling only from university students would miss other age groups, educational backgrounds, and occupations.
Mark Scheme
AO1 (3 marks): Clear outline of both sampling methods — random sampling (every member has equal chance of selection, method involves complete list and random selection) and opportunity sampling (selecting whoever is available at the time).
AO3 (3 marks): Evaluation of both methods. At least one strength and one limitation of each. May include: representativeness, generalisability, practicality, bias, time and cost considerations.
Scoring your answers…
Research methods in psychology are systematic procedures used to observe, describe, predict, and explain behavior and mental processes. They include experiments, surveys, case studies, and naturalistic observations, ensuring data collection is objective and reliable to understand and explain psychological phenomena.
Hypotheses
Hypotheses are statements about the prediction of the results, that can be verified or disproved by some investigation.
There are four types of hypotheses:
- Null Hypotheses (H0) – these predict that no difference will be found in the results between the conditions. Typically these are written ‘There will be no difference…’
- Alternative Hypotheses (Ha or H1)– these predict that there will be a significant difference in the results between the two conditions. This is also known as the experimental hypothesis.
- One-tailed (directional) hypotheses – these state the specific direction the researcher expects the results to move in, e.g. higher, lower, more, less. In a correlation study, the predicted direction of the correlation can be either positive or negative.
- Two-tailed (non-directional) hypotheses – these state that a difference will be found between the conditions of the independent variable but does not state the direction of a difference or relationship. Typically these are always written ‘There will be a difference ….’
All research has an alternative hypothesis (either a one-tailed or two-tailed) and a corresponding null hypothesis.
Once the research is conducted and results are found, psychologists must accept one hypothesis and reject the other.
So, if a difference is found, the psychologist would accept the alternative hypothesis and reject the null. The opposite applies if no difference is found.
Sampling Techniques
Sampling is the process of selecting a representative group from the population under study.
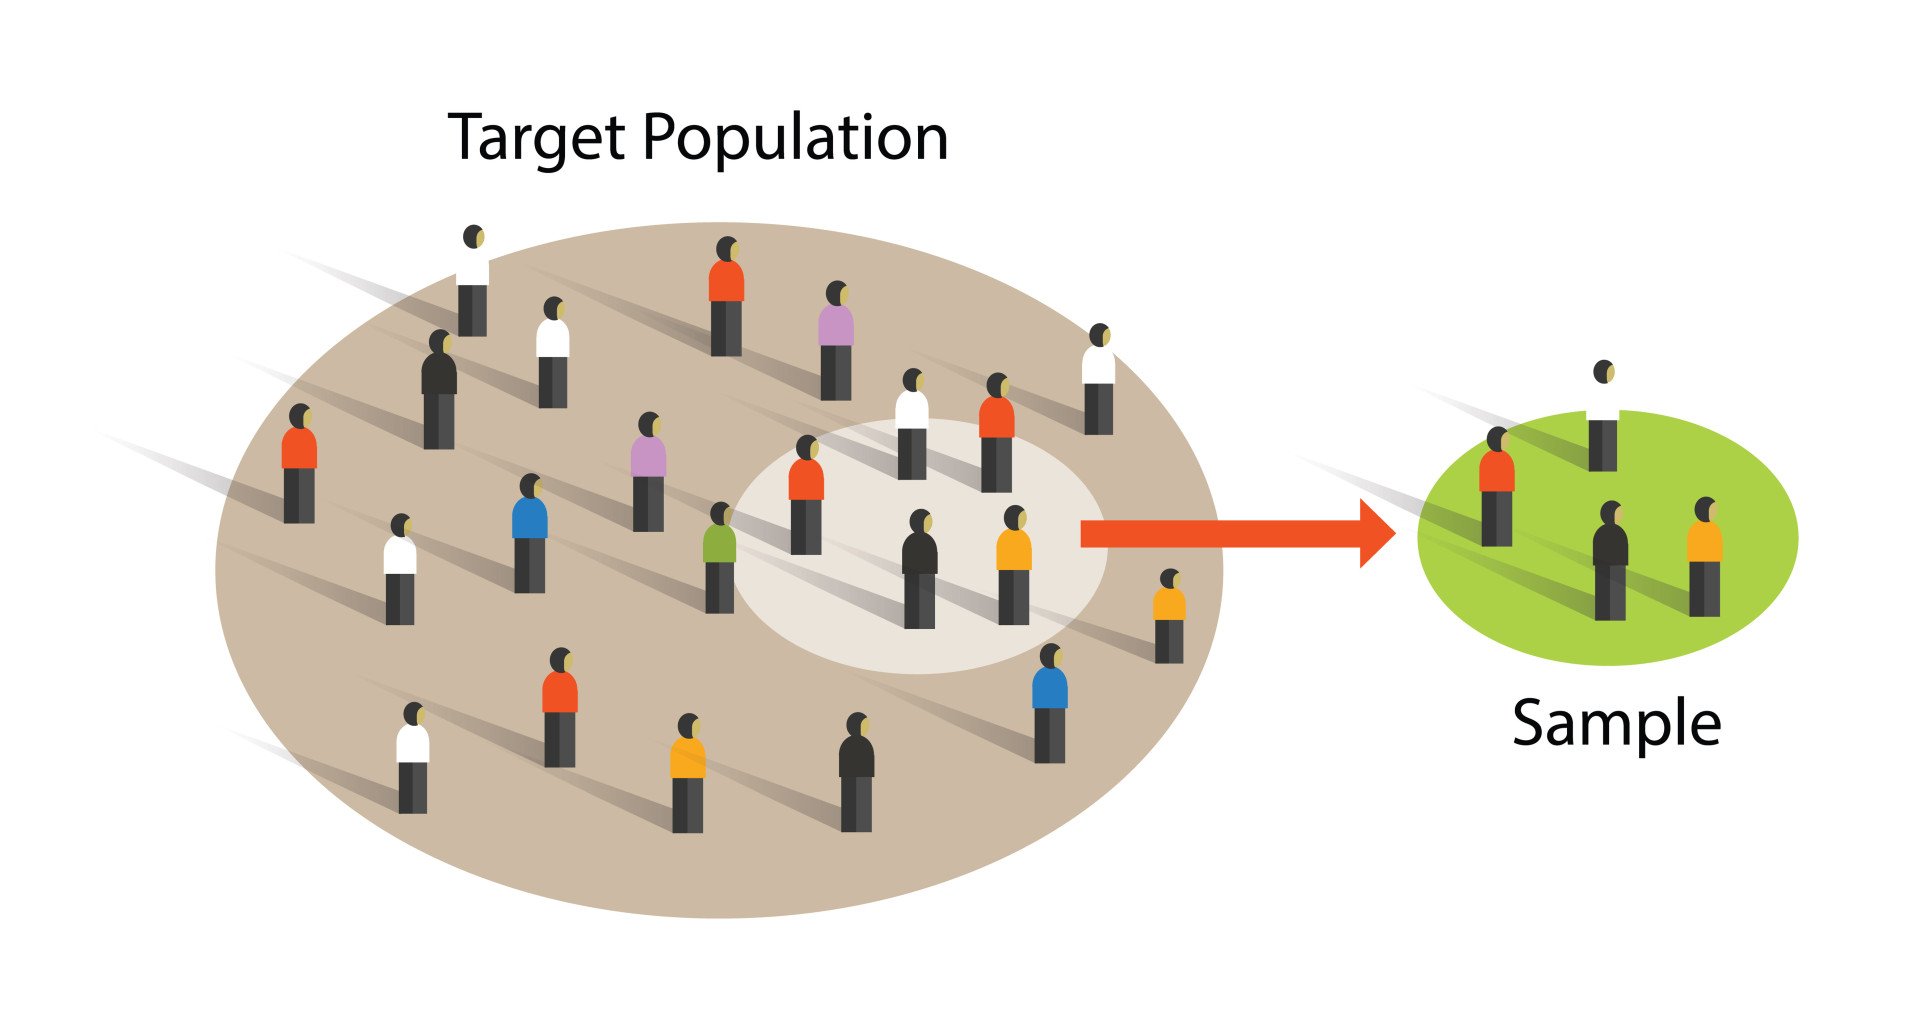
A sample is the participants you select from a target population (the group you are interested in) to make generalizations about.
Representative means the extent to which a sample mirrors a researcher’s target population and reflects its characteristics.
Generalisability means the extent to which their findings can be applied to the larger population of which their sample was a part.
- Volunteer sample: where participants pick themselves through newspaper adverts, noticeboards or online.
- Opportunity sampling: also known as convenience sampling, uses people who are available at the time the study is carried out and willing to take part. It is based on convenience.
- Random sampling: when every person in the target population has an equal chance of being selected. An example of random sampling would be picking names out of a hat.
- Systematic sampling: when a system is used to select participants. Picking every Nth person from all possible participants. N = the number of people in the research population / the number of people needed for the sample.
- Stratified sampling: when you identify the subgroups and select participants in proportion to their occurrences.
- Snowball sampling: when researchers find a few participants, and then ask them to find participants themselves and so on.
- Quota sampling: when researchers will be told to ensure the sample fits certain quotas, for example they might be told to find 90 participants, with 30 of them being unemployed.
Variables
Experiments always have an independent and dependent variable.
- The independent variable is the one the experimenter manipulates (the thing that changes between the conditions the participants are placed into). It is assumed to have a direct effect on the dependent variable.
- The dependent variable is the thing being measured, or the results of the experiment.

Operationalization means making variables measurable and quantifiable. We must operationalise variables so they can be tested.
We can’t directly measure ‘happiness’, but we can count how many times someone smiles in two hours.
Operationalizing a variable lets other researchers replicate the study. That matters, because replication is how findings get checked for reliability.
Extraneous variables are anything other than the independent variable that could affect the results.
Some are participant variables, like intelligence, gender, or age. Others are situational, like lighting or noise.
Demand characteristics are one such variable: participants work out a study’s aims and start behaving accordingly, often to be a “good participant” (Orne, 1962).
Critics of Milgram’s obedience research argued on exactly these grounds. Participants may have worked out the shocks were fake and administered them anyway, simply because that seemed to be what the study wanted.
Extraneous variables must be controlled so they cannot confound the results.
Random allocation or a matched pairs design reduces participant variables. Situational variables are controlled through standardised procedures that treat every participant identically.
Investigator Effects and Blinding
Researchers can bias a study too, without meaning to. Rosenthal (1966) called this investigator (experimenter) effect: a researcher’s own expectations can subtly change their tone, warmth, or treatment of participants, and so change the results.
In a classic demonstration, experimenters were falsely told their rats were bred to be “maze-bright” or “maze-dull.” The “maze-bright” rats then learned faster. Yet all the rats had been randomly allocated from the same population (Rosenthal & Fode, 1963). The experimenters’ own expectations had shaped how they treated the animals.
The same effect works on people.
When teachers were told that certain randomly chosen pupils were about to “bloom” academically, those pupils went on to show greater IQ gains than their classmates. It was a self-fulfilling prophecy, created purely by what the teachers had been told (Rosenthal & Jacobson, 1968).
The standard fix is blinding. In a single-blind study, participants do not know which condition they are in. A double-blind study also keeps the researcher blind to each participant’s condition, so neither side’s expectations can bias the result.
Experimental Design
Experimental design refers to how participants are allocated to each condition of the independent variable, such as a control or experimental group.
- Independent design (between-groups design): each participant is selected for only one group. With the independent design, the most common way of deciding which participants go into which group is by means of randomization.
- Matched participants design: each participant is selected for only one group, but the participants in the two groups are matched for some relevant factor or factors (e.g. ability; sex; age).
- Repeated measures design (within groups): each participant appears in both groups, so that there are
exactly the same participants in each group. - The main problem with the repeated measures design is that there may well be order effects. Their experiences during the experiment may change the participants in various ways.
- They may perform better when they appear in the second group because they have gained useful information about the experiment or about the task. On the other hand, they may perform less well on the second occasion because of tiredness or boredom.
- Counterbalancing is the best way of preventing order effects from disrupting the findings of an experiment, and involves ensuring that each condition is equally likely to be used first and second by the participants.
If we wish to compare two groups on a given independent variable, the two groups must not differ in any other important way. Otherwise, we cannot be sure the IV caused any difference we find.
Experimental Methods
All experimental methods involve an IV (independent variable) and DV (dependent variable).
- Lab Experiments are conducted in a well-controlled environment, not necessarily a laboratory, and therefore accurate and objective measurements are possible.
The researcher decides where the experiment will take place, at what time, with which participants, in what circumstances, using a standardized procedure.
- Field experiments are conducted in the everyday (natural) environment of the participants. The experimenter still manipulates the IV, but in a real-life setting. It may be possible to control extraneous variables, though such control is more difficult than in a lab experiment.
- Natural experiments are when a naturally occurring IV is investigated that isn’t deliberately manipulated, it exists anyway. Participants are not randomly allocated, and the natural event may only occur rarely.
Case Study
Case studies are in-depth investigations of a single person, group, event, or community. They draw on a range of sources, including the person themselves and their family and friends.
Researchers may combine interviews, psychological tests, observations, and experiments. Case studies are usually longitudinal, following the individual or group over an extended period.
Some of the best-known case studies in psychology were carried out by Sigmund Freud. He investigated the private lives of his patients in detail, aiming to understand and help them overcome their illnesses.
Case studies provide rich qualitative data with high ecological validity. Generalising from them is hard, though. Each case has unique characteristics that may not apply to anyone else.
Correlational Studies
Correlation means association. It is a measure of how far two variables move together, one treated as the predictor and the other as the outcome.
A correlational study takes two measures from the same group of participants and checks how closely they are associated.
The predictor is simply whichever variable is used to predict the outcome. It need not be a cause.
Relationships between variables can be plotted on a graph or summarised as a correlation coefficient.

- If an increase in one variable tends to be associated with an increase in the other, then this is known as a positive correlation.
- If an increase in one variable tends to be associated with a decrease in the other, then this is known as a negative correlation.
- A zero correlation occurs when there is no relationship between variables.
After plotting the scattergraph, a statistical test of correlation, such as Spearman’s rho, confirms whether a significant relationship really exists between the two variables.
The test gives a score called a correlation coefficient, a number between −1 and +1 showing how strong the relationship is. Zero means no relationship at all.
The closer the score sits to either extreme, the stronger the relationship. A coefficient can be positive, such as 0.63, or negative, such as −0.63.

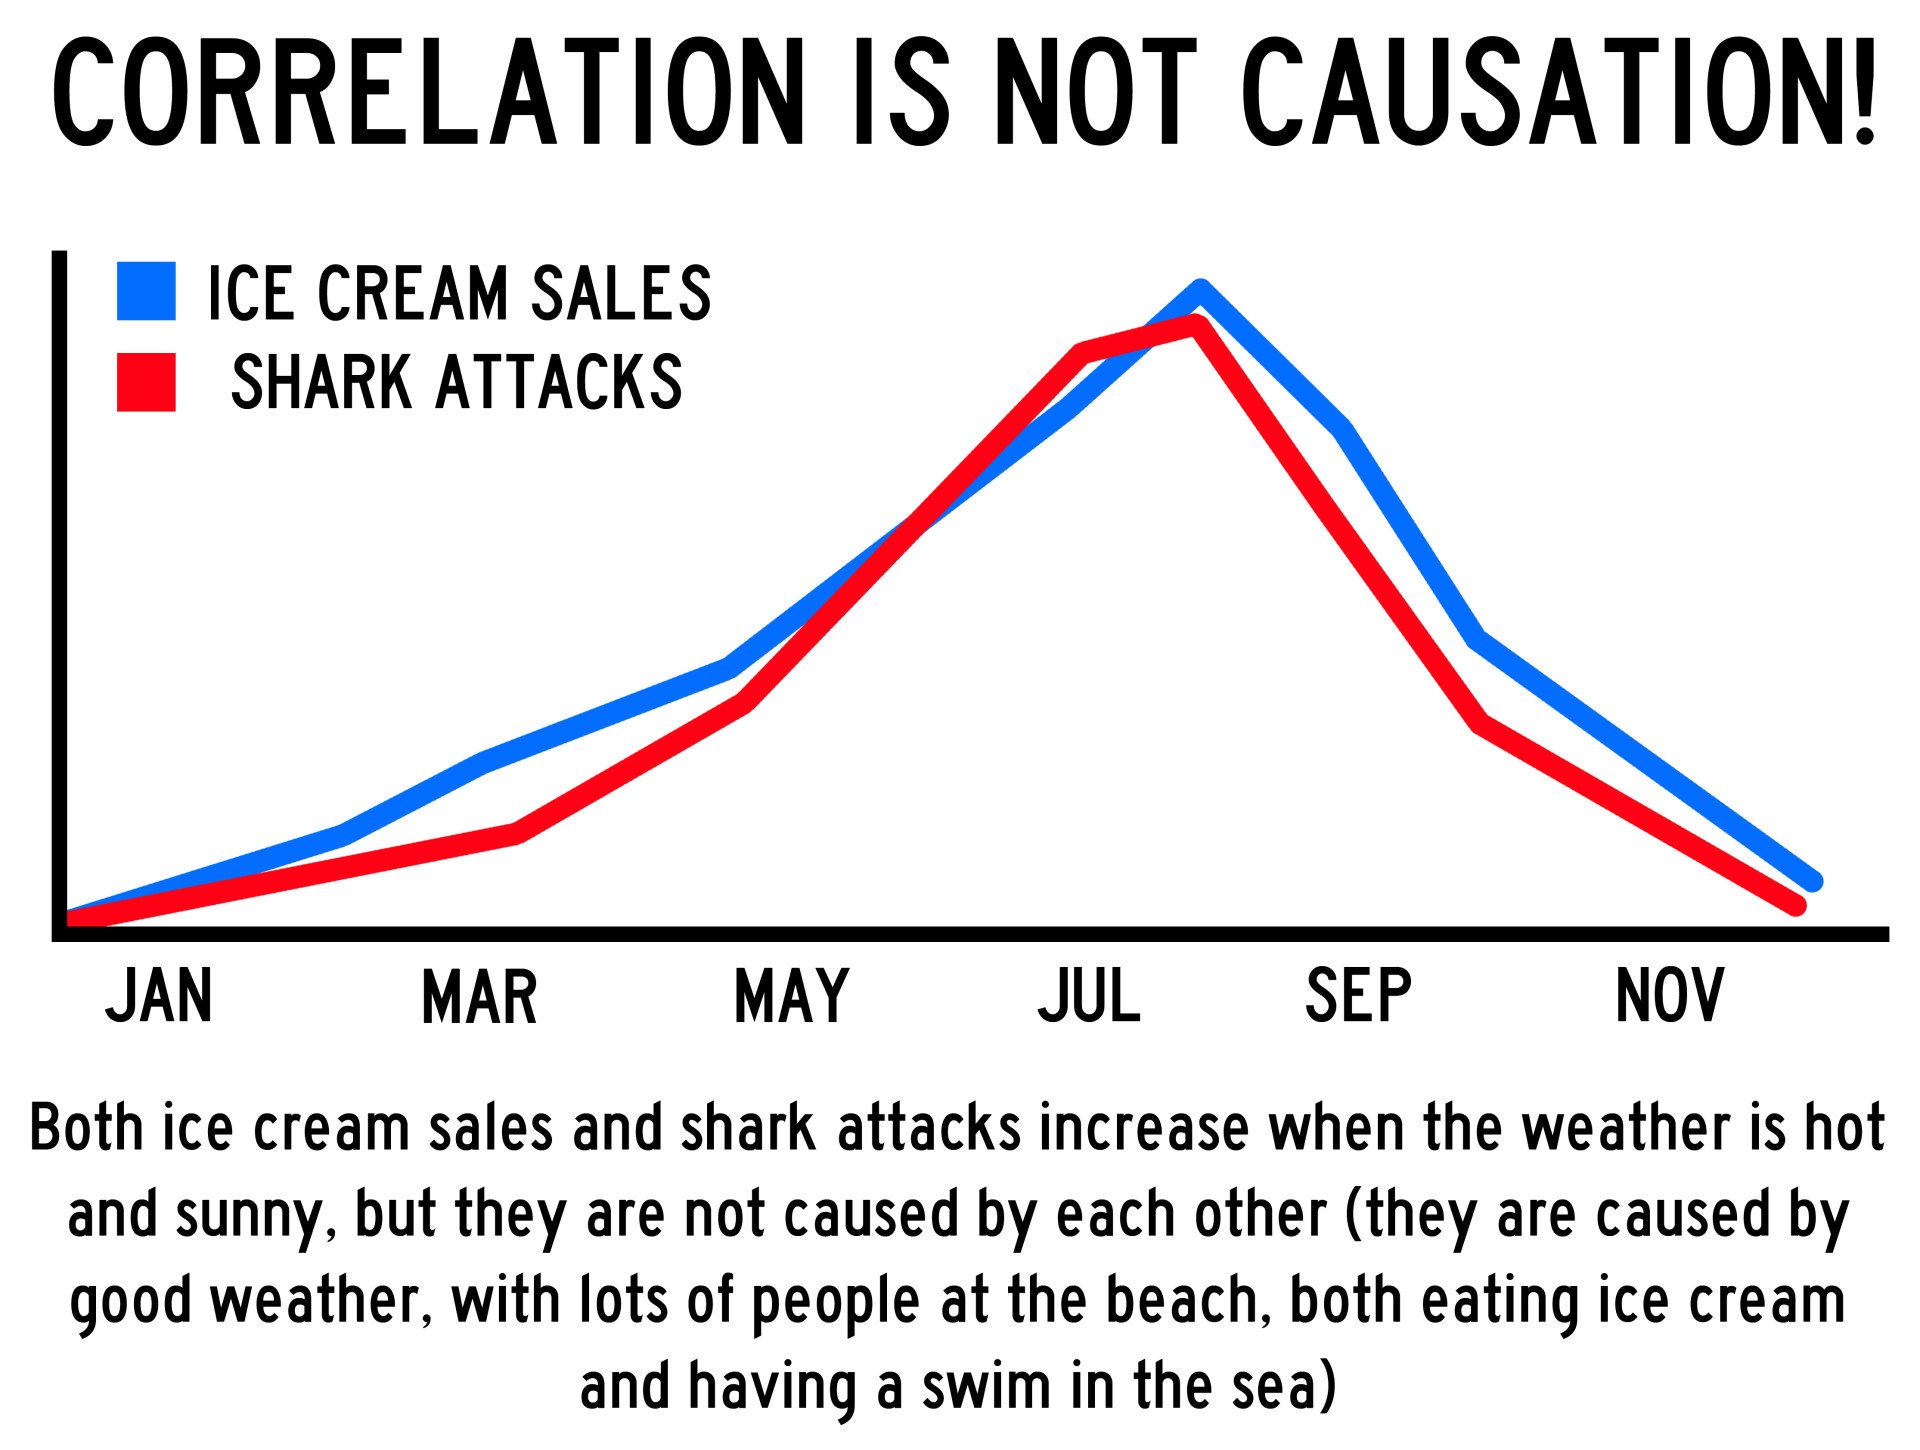
A correlation between variables, however, does not automatically mean that the change in one variable is the cause of the change in the values of the other variable. A correlation only shows if there is a relationship between variables.
Correlation does not always prove causation, as a third variable may be involved.
Interview Methods
Interviews are commonly divided into two types: structured and unstructured.
- Structured interviews are formal. The interview situation is standardized as far as possible. Structured interviews are formal, like job interviews.
A fixed, predetermined set of questions is put to every participant in the same order and in the same way.
Responses are recorded on a questionnaire, and the researcher presets the order and wording of questions, and sometimes the range of alternative answers.
The interviewer stays within their role and maintains social distance from the interviewee.
- Unstructured interviews are informal, like casual conversations. A general conversation normally precedes them, and the researcher deliberately adopts an informal approach to break down social barriers.
There are no set questions, and the participant can raise whatever topics he/she feels are relevant and ask them in their own way. Questions are posed about participants’ answers to the subject
Unstructured interviews are most useful in qualitative research to analyze attitudes and values.
Though they rarely provide a valid basis for generalization, their main advantage is that they enable the researcher to probe social actors’ subjective point of view.
Questionnaire Method
Questionnaires can be thought of as a kind of written interview. They can be carried out face to face, by telephone, or post.
The choice of questions is important because of the need to avoid bias or ambiguity in the questions, ‘leading’ the respondent or causing offense.
- Open questions are designed to encourage a full, meaningful answer using the subject’s own knowledge and feelings. They provide insights into feelings, opinions, and understanding. Example: “How do you feel about that situation?”
- Closed questions can be answered with a simple “yes” or “no” or specific information, limiting the depth of response. They are useful for gathering specific facts or confirming details. Example: “Do you feel anxious in crowds?”
- Postal questionnaires seem to offer the opportunity of getting around the problem of interview bias by reducing the personal involvement of the researcher.
Its other practical advantages are that it is cheaper than face-to-face interviews and can be used to contact many respondents scattered over a wide area relatively quickly.
Observations
There are different types of observation methods:
- Covert observation is where the researcher doesn’t tell the participants they are being observed until after the study is complete. There could be ethical problems or deception and consent with this particular observation method.
- Overt observation is where a researcher tells the participants they are being observed and what they are being observed for.
- Controlled: behavior is observed under controlled laboratory conditions (e.g., Bandura’s Bobo doll study).
- Natural: Here, spontaneous behavior is recorded in a natural setting.
- Participant: Here, the observer has direct contact with the group of people they are observing. The researcher becomes a member of the group they are researching.
- Non-participant (aka “fly on the wall): The researcher does not have direct contact with the people being observed. The observation of participants’ behavior is from a distance
Pilot Study
A pilot study is a small scale preliminary study conducted in order to evaluate the feasibility of the key steps in a future, full-scale project.
This step matters. A pilot study is an initial run-through of the procedures on a few people before the full investigation begins. It saves time and, in some cases, money by catching flaws in the design early.
A pilot study can also help the researcher spot ambiguities or confusing wording in the information given to participants. It can catch task problems too.
Two problems a pilot study can catch are floor and ceiling effects. A task that is too hard produces a floor effect: none of the participants can complete it, so every score is low.
A task that is too easy produces the opposite, a ceiling effect, where almost everyone “hits the ceiling” with a near-perfect score.
Research Design
In cross-sectional research, a researcher compares different segments of the population at one point in time.
Other times we want to track change instead. Longitudinal research gathers data from the same people repeatedly, over an extended period, as in studies of human development.
In cohort studies, participants share a common factor, such as age or occupation. This is one type of longitudinal design.
Mixed methods research combines more than one method in a single study. Doing so can strengthen validity.
Reliability
Reliability is a measure of consistency, if a particular measurement is repeated and the same result is obtained then it is described as being reliable.
- Test-retest reliability: assessing the same person on two different occasions which shows the extent to which the test produces the same answers.
- Inter-observer reliability: the extent to which there is an agreement between two or more observers.
Meta-Analysis
Meta-analysis is a statistical procedure used to combine and synthesize findings from multiple independent studies to estimate the average effect size for a particular research question.
Meta-analysis goes beyond traditional narrative reviews by using statistical methods to integrate the results of several studies, leading to a more objective appraisal of the evidence.
This is done by looking through various databases, and then decisions are made about what studies are to be included/excluded.
- Strengths: Increases the conclusions’ validity as they’re based on a wider range.
- Weaknesses: Research designs in studies can vary, so they are not truly comparable.
Peer Review
A researcher submits an article to a journal, chosen for its audience or prestige. The journal then selects two or more experts in the same field to review it, unpaid.
The reviewers assess the study’s methods and design, the originality and validity of the findings, and the quality of its content, structure and language. Their feedback determines whether the article is accepted:
- Accepted as it is.
- Accepted with revisions the author must make.
- Revise and resubmit, sent back for a fresh review.
- Rejected, with no option to resubmit.
The editor makes the final decision, based on the reviewers’ comments.
Peer review keeps faulty data out of the public domain. It checks the validity of findings and the quality of the methodology, and it is used to assess university departments’ research ratings.
In practice, though, it has real problems.
- Slows publication: the review process can hold back new work for months.
- May suppress unusual findings: reviewers can reject work that challenges the field’s consensus, or a rival’s work.
- Cannot guarantee honesty: some doubt whether peer review reliably catches fraudulent research.
- Losing ground online: more research and commentary is published without formal peer review than before, though online communities increasingly review and critique work themselves.
Types of Data
- Quantitative data is numerical data e.g. reaction time or number of mistakes. It represents how much or how long, how many there are of something. A tally of behavioral categories and closed questions in a questionnaire collect quantitative data.
- Qualitative data is non-numerical and is displayed in words. It is descriptive in nature. This type of data can come from things like interview transcripts or responses to open questionation. Open questions in questionnaires and accounts from observational studies collect qualitative data.
- Primary data is information obtained first-hand by the researcher specifically for the investigation they are conducting. Data collected by a researcher dealing directly with participants is primary data.
- Secondary data is information that already exists, having been collected by someone else or for a different purpose. E.g. meta-analysis: A type of secondary data analysis where researchers pool findings from multiple studies to create a single, overall conclusion.
Converting Qualitative Data to Quantitative Data
Sometimes researchers collect qualitative data and then convert it into numbers for analysis.
Content analysis quantifies qualitative content through coding or categorisation. It is a form of indirect observation, examining the artefacts, communications, or media that people produce.
It works by taking qualitative data, such as interview transcripts or diary extracts, and converting it into numerical form.
One way is to identify themes, words, phrases, or categories and count how often they appear. A simpler approach sorts scores into bands.
For example, mood scores could be grouped into ‘under 40′, ’40 to 60’, and ‘over 60’.
This gives a numerical result per participant or category. The method converts existing qualitative data; it does not involve collecting new data.
Validity
Validity means how well a piece of research actually measures what it sets out to, or how well it reflects the reality it claims to represent.
Validity is whether the observed effect is genuine and represents what is actually out there in the world.
- Internal validity is whether the change in the DV was really caused by the IV, rather than by confounding variables, demand characteristics, or investigator effects. Control, randomisation, and blinding all protect it.
- Concurrent validity is the extent to which a psychological measure relates to an existing similar measure and obtains close results. For example, a new intelligence test compared to an established test.
- Face validity: does the test measure what it’s supposed to measure ‘on the face of it’. This is done by ‘eyeballing’ the measuring or by passing it to an expert to check.
- Construct validity is whether a measure really captures the underlying concept it is meant to represent, rather than something else.
- Ecological validity is the extent to which findings from a research study can be generalized to other settings / real life.
- Temporal validity is the extent to which findings from a research study can be generalized to other historical times.
Features of Science
- Paradigm – A set of shared assumptions and agreed methods within a scientific discipline.
- Paradigm shift – The result of the scientific revolution: a significant change in the dominant unifying theory within a scientific discipline.
- Objectivity – When all sources of personal bias are minimised so not to distort or influence the research process.
- Empirical method – Scientific approaches that are based on the gathering of evidence through direct observation and experience.
- Replicability – The extent to which scientific procedures and findings can be repeated by other researchers.
- Falsifiability – The principle that a theory cannot be considered scientific unless it admits the possibility of being proved untrue.
Statistical Significance
Significance in a statistical test means the observed difference between groups is unlikely to be down to chance.
The result is unlikely to be chance.
If the test is significant, we reject the null hypothesis and accept the alternative.
If it is not significant, we do the opposite: accept the null and reject the alternative.
A null hypothesis states there is no effect.
In Psychology, we normally use p < 0.05. This strikes a balance between a type I and a type II error. Sometimes a stricter bar is needed. Tests where a wrong result could cause harm, such as trialling a new drug, use the stricter p < 0.01.
A type I error rejects the null hypothesis when it should have been accepted. This is an error of optimism, from too lenient a significance level.
A type II error is the opposite mistake. It accepts the null hypothesis when it should have been rejected, an error of pessimism from too strict a level.
Statistical Tests
Statistical tests are used to determine whether there is a significant difference or a correlation between two sets of data.
When conducting research, after collecting data, statistical tests help you decide whether the observed results are likely to have occurred by chance or if they represent a real effect.
This informs the decision to accept or reject the null hypothesis.
The choice of a statistical test depends on several factors:
- Whether the study is looking for a difference or a correlation (association).
- The experimental design used (e.g., independent groups, repeated measures, matched pairs). For the purpose of choosing a statistical test, repeated measures and matched pairs designs are often considered the same.
- The level of measurement of the data (nominal, ordinal, or interval).
Tests looking for a difference:
- Sign Test: The sign test can only be used when the study is looking for a difference, employs a related experimental design (repeated measures), and has collected nominal data. To conduct a sign test, you state the hypotheses, record the data and determine the sign of the difference between conditions, find the calculated value ‘S’ (the less frequent sign), and compare it to the critical value to determine significance.
- Wilcoxon Signed-Rank Test: The Wilcoxon test is a more appropriate statistical test of difference for data from a repeated/related design where the data are at the ordinal level of measurement (non-parametric). This test is used when the same participants are assessed in both conditions and the data can be ranked.
- Mann-Whitney U Test: The Mann-Whitney U test is a non-parametric test used to compare two independent groups when the data is ordinal or interval/ratio but not normally distributed.
- Related t-test: The related t-test (also known as paired t-test) is a parametric test used to find a difference between two sets of scores from a related design (repeated measures or matched pairs) where the data is interval. Some sources suggest it can be used with ordinal data if there is justification that the test is robust enough to cope with data on a numerical scale.
- Unrelated t-test: The unrelated t-test (also known as independent samples t-test) is a parametric test used to find a difference between two sets of scores from an independent groups design where the data is interval.
Tests looking for a correlation (association):
- Spearman’s Rho: Spearman’s rho is an inferential test mainly used on ordinal data to assess the strength and direction of a correlation between two co-variables. It cannot be used as a test of difference. For data to be statistically significant, the calculated value must be equal to or higher than the critical value.
- Pearson’s r: Pearson’s r is a parametric test used to assess the strength and direction of a linear correlation between two co-variables when the data is at the interval level.
- Chi-Squared Test: it looks for a difference or an association between two variables when the data is nominal or categorical. Each participant’s data falls into one of several categories.
Levels of Measurement:
- Nominal Data: This is categorical data where items are placed into distinct categories that cannot be ordered. Examples include gender or colour. The mode is a useful measure of central tendency for nominal data.
- Ordinal Data: This is data that can be ordered or ranked, but the intervals between each unit are not necessarily equal and are often based on subjective opinions. Examples include rankings of preference or Likert scale responses. The median and range are appropriate descriptive statistics for ordinal data.
- Interval Data: This is data based on numerical scales with equal and precisely defined intervals. However, interval data does not have a meaningful zero point (e.g., temperature in Celsius). The mean and standard deviation are suitable for interval data, and parametric tests require this level of data.
Parametric tests (related t-test, unrelated t-test, Pearson’s r) are considered more powerful than non-parametric tests (sign test, Wilcoxon, Mann-Whitney, Spearman’s rho, Chi-Squared). They need interval data.
Choosing the right statistical test means weighing up these three factors together. Getting the choice right is what lets you draw valid conclusions from your data.
Ethical Issues
- Informed consent is when participants are able to make an informed judgment about whether to take part. It causes them to guess the aims of the study and change their behavior.
- To deal with it, we can gain presumptive consent or ask them to formally indicate their agreement to participate but it may invalidate the purpose of the study and it is not guaranteed that the participants would understand.
- Deception should only be used when it is approved by an ethics committee, as it involves deliberately misleading or withholding information. Participants should be fully debriefed after the study but debriefing can’t turn the clock back.
- All participants should be informed at the beginning that they have the right to withdraw if they ever feel distressed or uncomfortable.
- It causes bias as the ones that stayed are obedient and some may not withdraw as they may have been given incentives or feel like they’re spoiling the study. Researchers can offer the right to withdraw data after participation.
- Participants should all have protection from harm. The researcher should avoid risks greater than those experienced in everyday life and they should stop the study if any harm is suspected. However, the harm may not be apparent at the time of the study.
- Confidentiality concerns the communication of personal information. The researchers should not record any names but use numbers or false names though it may not be possible as it is sometimes possible to work out who the researchers were.
Critical Evaluation of the Experimental Method
The experiment is the only method that lets psychologists make cause-and-effect claims, because the researcher manipulates the IV, holds other variables constant, and observes the effect on the DV. That strength comes with real trade-offs.
Strengths of the experimental method:
- Causal claims: manipulating the IV and randomly allocating participants rules out reverse causation and spreads other differences by chance, something no other method can do (Fisher, 1935).
- Reliability: standardised procedures and clear operational definitions allow exact replication, which is how findings get checked.
- Precision: quantitative DVs allow statistical testing and let results be pooled across studies in a meta-analysis.
- Flexibility: the method spans the control of the lab, the realism of the field, and natural experiments’ reach into events that could never be staged ethically.
Limitations of the experimental method:
- Artificiality: high control can make tasks unrealistic, so lab findings may not reflect everyday behaviour (Liebert & Baron, 1972).
- Social influence: participants pick up on demand characteristics (Orne, 1962), and experimenters can unwittingly shape results through their own expectations (Rosenthal, 1966).
- Restricted scope: many important variables, such as gender, age, trauma, or culture, cannot be manipulated, which forces a retreat to quasi- and natural experiments with weaker causal claims.
- Ethical constraints: consent, deception, and protection-from-harm rules properly limit what can be manipulated.
The Replication Crisis
Psychology’s confidence in its own findings was shaken when researchers tried to repeat 100 published studies and check whether the original results held up.
Aim: To estimate how reproducible published psychological findings actually are, by directly replicating a large sample of studies.
Method: The Open Science Collaboration (2015) recruited many independent teams, who each replicated one of 100 studies from three major journals using the original materials and procedures.
Results: Only 36% of the replications reached statistical significance, and replication effect sizes averaged about half the size of the originals. Overall, only around a third to a half of the original findings held up.
Conclusion: A large share of published findings do not hold up under direct replication. The causes were already well documented: undisclosed flexibility in analysis (Simmons, Nelson, & Simonsohn, 2011), questionable research practices (John, Loewenstein, & Prelec, 2012), and chronically underpowered studies (Cohen, 1962).
The reform movement responds directly to these causes.
Preregistration of hypotheses and analysis plans before data collection, larger samples, and routine reporting of effect sizes are now standard advice (Nosek, Ebersole, DeHaven, & Mellor, 2018). A finding that cannot survive replication was never well supported in the first place.
Statistical Distributions
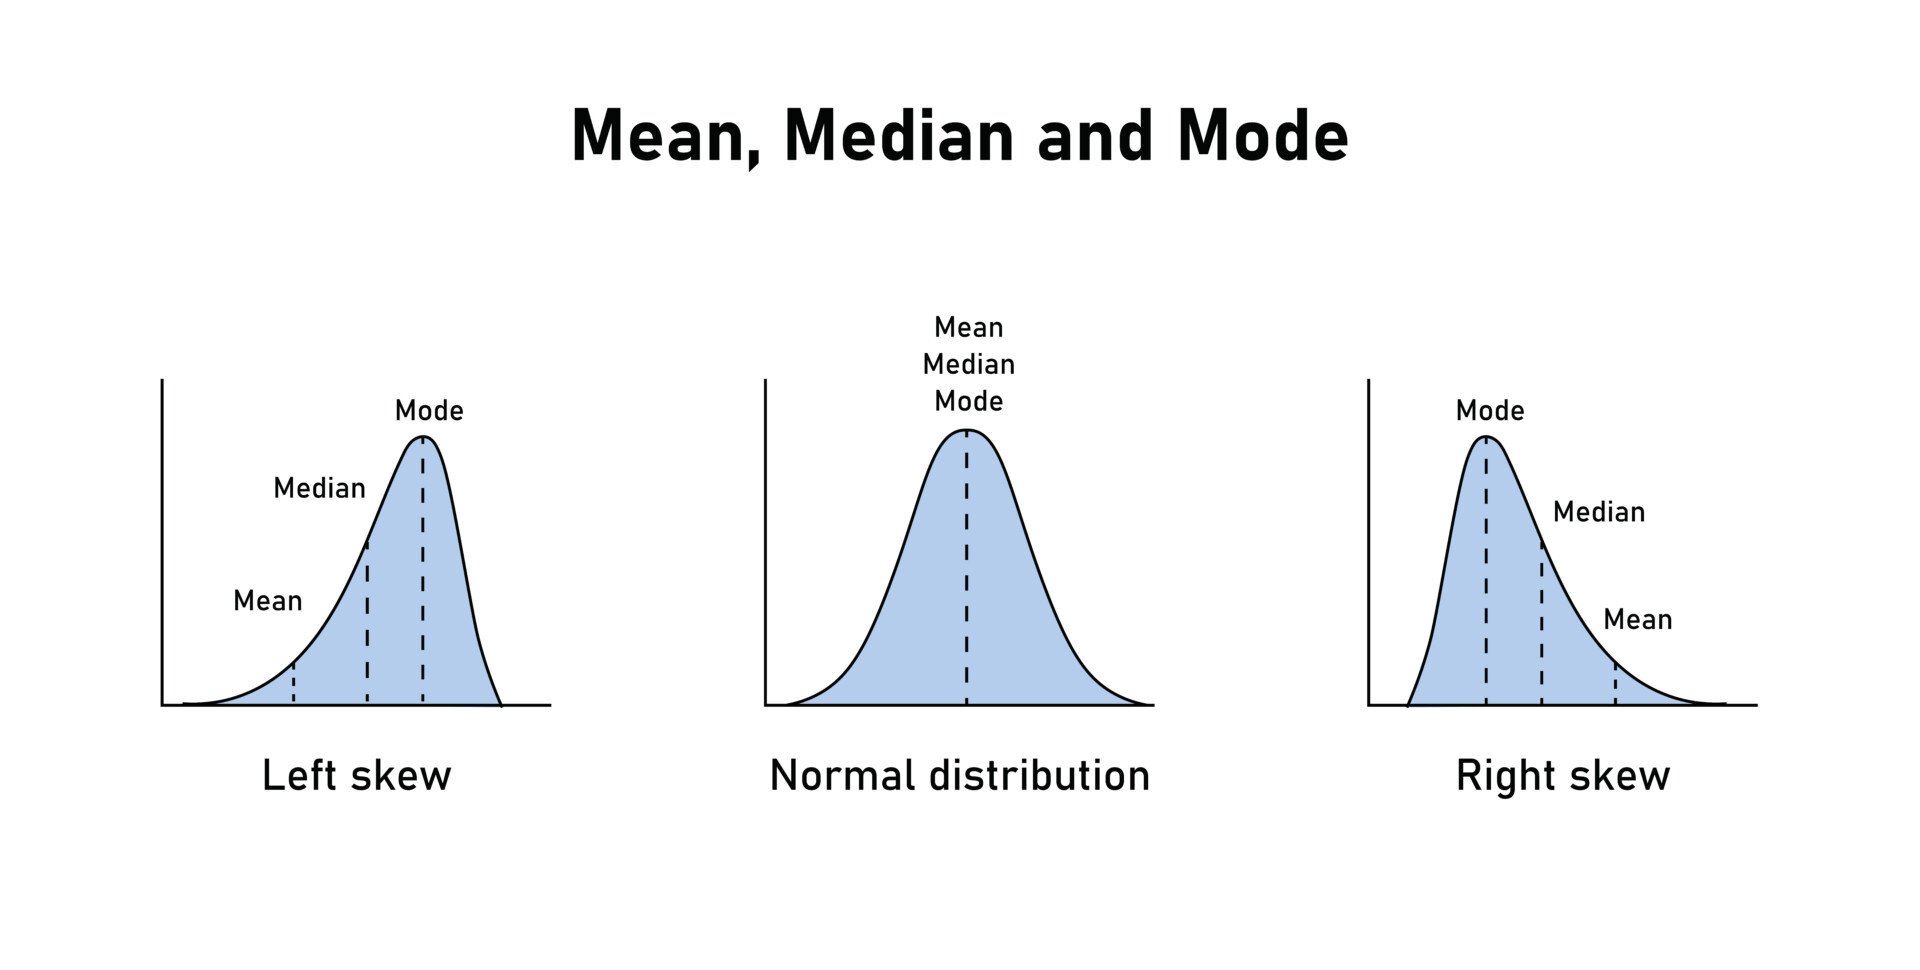
A normal distribution is symmetrical, with most of the data clustered around the mean, median, and mode, which are all equal.
The scores taper off evenly towards both extremes, forming a bell-shaped curve.s
A skewed distribution is asymmetrical, with the majority of the data concentrated at one end.
In a positively skewed distribution, the tail extends to the right, indicating a concentration of lower scores and a few high outliers.
In a negatively skewed distribution, the tail extends to the left, indicating a concentration of higher scores and a few low outliers
References
Cohen, J. (1962). The statistical power of abnormal-social psychological research: A review. Journal of Abnormal and Social Psychology, 65(3), 145–153.
Fisher, R. A. (1935). The design of experiments. Oliver & Boyd.
John, L. K., Loewenstein, G., & Prelec, D. (2012). Measuring the prevalence of questionable research practices with incentives for truth telling. Psychological Science, 23(5), 524–532.
Liebert, R. M., & Baron, R. A. (1972). Some immediate effects of televised violence on children’s behavior. Developmental Psychology, 6(3), 469–475.
Nosek, B. A., Ebersole, C. R., DeHaven, A. C., & Mellor, D. T. (2018). The preregistration revolution. Proceedings of the National Academy of Sciences, 115(11), 2600–2606.
Open Science Collaboration. (2015). Estimating the reproducibility of psychological science. Science, 349(6251), aac4716.
Orne, M. T. (1962). On the social psychology of the psychological experiment: With particular reference to demand characteristics and their implications. American Psychologist, 17(11), 776–783.
Rosenthal, R. (1966). Experimenter effects in behavioral research. Appleton-Century-Crofts.
Rosenthal, R., & Fode, K. L. (1963). The effect of experimenter bias on the performance of the albino rat. Behavioral Science, 8, 183–189.
Rosenthal, R., & Jacobson, L. (1968). Pygmalion in the classroom: Teacher expectation and pupils’ intellectual development. Holt, Rinehart & Winston.
Simmons, J. P., Nelson, L. D., & Simonsohn, U. (2011). False-positive psychology: Undisclosed flexibility in data collection and analysis allows presenting anything as significant. Psychological Science, 22(11), 1359–1366.