A research hypothesis, in its plural form “hypotheses,” is a specific, testable prediction about the anticipated results of a study, established at its outset. It is a key component of the scientific method.
Hypotheses connect theory to data and guide the research process towards expanding scientific understanding.
Some key points about hypotheses:
- A hypothesis expresses an expected pattern or relationship. It connects the variables under investigation.
- It is stated in clear, precise terms before any data collection or analysis occurs. This makes the hypothesis testable.
- A hypothesis must be falsifiable. It should be possible, even if unlikely in practice, to collect data that disconfirms rather than supports the hypothesis.
- Hypotheses guide research. Scientists design studies to explicitly evaluate hypotheses about how nature works.
- For a hypothesis to be valid, it must be testable against empirical evidence. The evidence can then confirm or disprove the testable predictions.
- Hypotheses are informed by background knowledge and observation, but go beyond what is already known to propose an explanation of how or why something occurs.
Predictions typically arise from a thorough knowledge of the research literature, curiosity about real-world problems or implications, and integrating this to advance theory. They build on existing literature while providing new insight.
Types of Research Hypotheses
Alternative Hypothesis
The research hypothesis is often called the alternative or experimental hypothesis, conventionally written H1. It proposes a relationship between two variables: the independent variable, which the researcher manipulates, and the dependent variable, measured in response.
The exact term depends on the method. In a true experiment, H1 is the experimental hypothesis, and rejecting the null licenses a causal claim. In correlational, quasi-experimental or observational research, the same statement is the alternative hypothesis, and it asserts only an association, not a cause.
A hypothesis linking social media use to loneliness can be supported without ever showing that one causes the other. Correlation is not causation.
The alternative hypothesis states that a relationship exists between the two variables: one affects the other. It predicts what will change in the dependent variable when the independent variable is manipulated.
A significant result matters. It shows the change is unlikely to be due to chance alone, supporting the theory under investigation. The alternative hypothesis can be directional or non-directional, and it is what researchers aim to support through their study.
Null Hypothesis
The null hypothesis (H0) states that no relationship exists between the two variables: one does not affect the other. The dependent variable does not change.
Results are put down to chance. The null hypothesis is the foundational contrast to the research hypothesis, giving statistical testing a neutral, objective starting point.
Here’s the twist. A significance test never directly evaluates H1. It calculates how surprising the data would be if H0 were true. H1 is never tested itself; it is simply what remains standing once the null is rejected.
One more thing often gets missed. Failing to reject it is not proof. A non-significant result fits both a true zero effect and a real effect the study was simply too small to detect.
Many statistical methods are built specifically to test the null in this way. Pairing a null with its alternative keeps research intentions explicit, and makes results comparable across studies.
Non-Directional Hypothesis
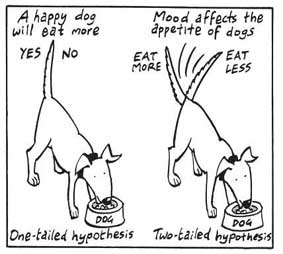
A non-directional hypothesis, or two-tailed hypothesis, predicts a difference between two variables without specifying its direction.
For example, “There is a difference in performance between Group A and Group B” is a non-directional hypothesis.
The literature must be genuinely unclear. A non-directional form fits when it is limited, mixed, or gives no clear steer on which way the effect should run.
The honest test is simple: would the researcher have been genuinely surprised by a result running the other way?
Directional Hypothesis
A directional (one-tailed) hypothesis predicts the direction of the independent variable’s effect on the dependent variable, not just that a difference exists.
For example, “Exercise increases weight loss” is a directional hypothesis.
Choosing this form is not a style preference. It is warranted only when prior research or theory gives sound grounds to expect one particular direction.
Researchers must be willing, in advance, to treat a reverse finding as a failure, not rewrite it as a discovery.
Falsifiability
The Falsification Principle
The Falsification Principle, proposed by Karl Popper, is a way of demarcating science from non-science. A theory or hypothesis counts as scientific only if it is testable and refutable.
Falsifiability demands more than confirmability. A scientific claim must carry genuine potential to be proven wrong (some possible evidence or experiment must be able to show it false).
However many confirming instances a theory accumulates, it takes only one contrary observation to falsify it. The hypothesis that all swans are white survives any number of white swans; a single black one destroys it.
Popper’s own target was psychoanalytic theory. He thought it could accommodate almost any behaviour and its opposite, so it risked nothing scientifically. That is a weakness, not a strength.
Popper wanted science to attempt to disprove a theory, not just accumulate evidence that supports it. A good hypothesis forbids a great deal, ruling out many possible observations, which is what exposes it to a genuine test.
The Duhem–Quine Problem
A prediction is never derived from a hypothesis alone. Testing it also depends on auxiliary assumptions about the equipment, the measures and the sample.
When a prediction fails, logic alone cannot say whether the hypothesis is wrong or one of these assumptions is. This is sometimes called the Duhem–Quine problem: a single disconfirmed prediction rarely refutes a hypothesis outright.
The name comes from two philosophers of science.
Duhem (1954) first made the argument for physics. Quine (1951) extended it to knowledge as a whole, arguing that any single claim can be preserved by revising something else instead.
The stakes differ by field. Meehl (1978) argued the problem is worse in psychology than in physics, where the auxiliary assumptions are themselves already well established. In psychology, the auxiliaries are often no better supported than the theory they are meant to protect.
Hypothesis vs. Research Question, Aim and Theory
These five terms get used loosely, and mixing them up is one of the most common mistakes in student writing.
Each sits at a different level of generality, from the broadest theory down to the single, specific prediction a study actually tests.
Theory, Aim and Research Question
A theory is a broad, organised explanation of a class of phenomena. It specifies constructs and the relationships between them. It is not directly testable, because it is stated in terms of unobservable constructs and covers indefinitely many situations.
A research aim is a statement of purpose, written in the infinitive: “to investigate whether…”. It is not a prediction. It commits the researcher to an activity, not to an outcome.
A research question is different again.
It poses the issue interrogatively, such as “Does background music impair reading comprehension?” Questions matter most in exploratory and qualitative work, where the goal is to describe a phenomenon rather than choose between rival outcomes.
A question cannot be rejected by data, the way a hypothesis can, and that is precisely its value in early, exploratory research.
Hypothesis and Prediction
A hypothesis is different again. It is a declarative, falsifiable statement about the relationship between operationalised variables, derived from theory. It asserts something that could turn out to be false.
A prediction is narrower still. It is the specific consequence that follows from the hypothesis given this design, these measures and this sample. Psychologists often use the two words interchangeably, and usually that is harmless.
It matters when a study fails.
A disconfirmed prediction does not cleanly refute the hypothesis, because it rests on assumptions about the measures, the manipulation and the sample as well.
Meehl (1978) argued this is exactly why psychology’s relationship to Popper’s idea of refutation is more troubled than psychologists usually admit.
A well-formed study states the aim, then the hypothesis, then the prediction, keeping the three distinct. A paper offering only an aim has committed to nothing. One offering only a prediction has severed its link to theory.
A theory can be right forever without being tested. A hypothesis is built to be proven wrong.
The rest of this article focuses on the hypothesis itself, the form it takes and how to write one well.
Can a Hypothesis be Proven?
Hypotheses make probabilistic predictions. They state the expected outcome if a particular relationship exists. However, a study result supporting a hypothesis does not definitively prove it is true.
All studies have limitations. There may be unknown confounding factors or issues that limit the certainty of conclusions. Additional studies may yield different results.
In science, hypotheses can realistically only be supported with some degree of confidence, not proven. The process of science is to incrementally accumulate evidence for and against hypothesized relationships in an ongoing pursuit of better models and explanations that best fit the empirical data. But hypotheses remain open to revision and rejection if that is where the evidence leads.
- Disproving a hypothesis is definitive. Solid disconfirmatory evidence will falsify a hypothesis and require altering or discarding it based on the evidence.
- However, confirming evidence is always open to revision. Other explanations may account for the same results, and additional or contradictory evidence may emerge over time.
We can never 100% prove the alternative hypothesis. Instead, we see if we can disprove, or reject the null hypothesis.
If we reject the null hypothesis, this doesn’t mean that our alternative hypothesis is correct but does support the alternative/experimental hypothesis.
Upon analysis of the results, an alternative hypothesis can be rejected or supported, but it can never be proven to be correct.
We must avoid any reference to results proving a theory as this implies 100% certainty, and there is always a chance that evidence may exist which could refute a theory.
Contemporary Research
This limit on what a single result can show has been demonstrated directly.
Open Science Collaboration (2015) repeated 100 published psychology studies using high-powered, pre-registered protocols.
Ninety-seven per cent of the original studies had reported a significant result. Only 36% of the replications did. Half the original effect vanished on average.
Simmons, Nelson and Simonsohn (2011) showed how easily a single study can mislead.
They used ordinary, widely tolerated flexibility in data analysis, such as trying more than one outcome measure or adding a few participants before checking again. The false-positive rate for a genuinely absent effect rose sharply. It reached above 60% when the four tricks were combined.
The recommended safeguard is to specify the hypothesis and the analysis plan before data collection. Preregistering a study this way keeps the distinction between generating a hypothesis and testing it verifiable, which is what gives the resulting p-value its meaning.
One newer strand asks a different question.
Scheel, Schijen and Lakens (2021) tested whether preregistration changes what gets published, not just what researchers claim about it. They compared 71 registered reports in psychology, where the hypothesis is locked in before data collection, against 152 standard hypothesis-testing articles.
The gap was stark. Ninety-six per cent of the standard articles reported support for their first hypothesis. Only 44% of the registered reports did.
The difference tracks the publication process, not the science. Once a study is guaranteed publication whatever it finds, the incentive to report only the hypotheses that worked disappears.
How to Write a Hypothesis
- Identify the Variables. Establish which variable the researcher manipulates (the independent variable) and which is the measured outcome (the dependent variable).
- Operationalise the Variables. Make the variables physically measurable or testable, e.g. if you are studying aggression, you might count the number of punches thrown.
- Decide on a Direction for Your Prediction. If there is evidence in the literature to support a specific effect of the independent variable on the dependent variable, write a directional (one-tailed) hypothesis. If the findings in the literature are limited or ambiguous, write a non-directional (two-tailed) hypothesis.
- Make It Testable. Ensure your hypothesis can be tested through experimentation or observation, and that it is possible in principle to prove it false (the principle of falsifiability).
- Use Clear and Concise Language. A strong hypothesis is short, typically one or two sentences, and phrased in straightforward terms, so it is easily understood and unambiguously testable.
- Pair It With an Explicit Null. State the null hypothesis alongside the alternative, so a reader can see exactly what claim the significance test is evaluating.
- Make It Precise Enough to Replicate. A well-written hypothesis lets an independent researcher, given only the hypothesis and the raw data, run the same analysis and reach the same conclusion.
Testing a Hypothesis: Significance, P-Values and Error Types
Once a hypothesis is written, a study collects data and puts it through a significance test. Understanding what this test actually shows, and what it does not, is essential to reading a result correctly.
What a Significance Test Actually Shows
A significance test does not examine the alternative hypothesis (H1) directly. It asks a narrower question.
It calculates how surprising the observed data would be if the null hypothesis (H0) were true. The logic runs backwards from the data. If the data would be very unlikely under H0, the researcher rejects the null and treats the result as support for H1.
The conventional cut-off is a p-value below .05. This means the researcher accepts up to a 5% chance of a false positive if H0 is actually true.
A smaller p-value does not mean a bigger or more important effect. Size and significance are different things. It depends on both the size of the effect and the sample size. A large enough study can turn a trivial difference into a very small p-value.
Type I and Type II Errors
Because the decision is made under uncertainty, two mistakes are possible when a result comes in. A Type I error is a false positive.
It means rejecting a true null hypothesis and concluding an effect exists when it does not. A Type II error is the opposite mistake. It is a false negative: failing to reject a false null hypothesis and missing a real effect.
Statistical power is the probability that a study detects a genuine effect of a given size. Low power raises the risk of a Type II error.
It also inflates the effect size (the magnitude of the result, independent of sample size) of any result that clears the significance bar. Only unusually large estimates pass the threshold in an underpowered study. A single small trial rarely tells the whole story.
Choosing a One-Tailed or Two-Tailed Test
The form of the hypothesis decides how the significance level is spread across the sampling distribution. This choice matters.
A two-tailed test, used for a non-directional hypothesis, splits the chosen alpha (the significance level fixed in advance, conventionally .05) between both tails. A result in either direction counts as evidence against the null. The choice is a trade-off.
A one-tailed test, used for a directional hypothesis, places the whole 5% in a single tail. This makes it easier to reach significance in the predicted direction.
A large effect in the unexpected direction is invisible to a one-tailed test. Size does not matter here.
The direction has to be chosen and recorded before the data are seen. Switching to a one-tailed test after seeing the results inflates the real error rate. This is hypothesising after the fact.
Examples
Consider a hypothesis many teachers might subscribe to: students work better on Monday morning than on Friday afternoon (IV=Day, DV=Standard of work).
Suppose the study gives the same students a lesson on Monday morning and again on Friday afternoon, then tests recall of each session’s material. The two hypotheses would read:
- The alternative hypothesis states that students will recall significantly more information on a Monday morning than on a Friday afternoon.
- The null hypothesis states that there will be no significant difference in the amount recalled on a Monday morning compared to a Friday afternoon. Any difference will be due to chance or confounding factors.
More Examples
- Memory: Participants exposed to classical music during study sessions will recall more items from a list than those who studied in silence.
- Social Psychology: Individuals who frequently engage in social media use will report higher levels of perceived social isolation compared to those who use it infrequently.
- Developmental Psychology: Children who engage in regular imaginative play have better problem-solving skills than those who don’t.
- Clinical Psychology: Cognitive-behavioral therapy will be more effective in reducing symptoms of anxiety over a 6-month period compared to traditional talk therapy.
- Cognitive Psychology: Individuals who multitask between various electronic devices will have shorter attention spans on focused tasks than those who single-task.
- Health Psychology: Patients who practice mindfulness meditation will experience lower levels of chronic pain compared to those who don’t meditate.
- Organizational Psychology: Employees in open-plan offices will report higher levels of stress than those in private offices.
- Behavioral Psychology: Rats rewarded with food after pressing a lever will press it more frequently than rats who receive no reward.
Key Takeaways
- H1 vs H0: The alternative hypothesis (H1) predicts a relationship or difference; the null hypothesis (H0) predicts none. A significance test evaluates H0, not H1, directly.
- Directional vs Non-Directional: A directional (one-tailed) hypothesis predicts which way an effect will go. A non-directional (two-tailed) hypothesis predicts only that a difference exists.
- Operationalisation: Both variables in a hypothesis must be defined in measurable terms before data collection, or the hypothesis cannot be tested.
- Falsifiability: A scientific hypothesis must be capable of being shown false by some possible evidence, not just capable of being confirmed.
- Never Proven: A study can support or fail to support a hypothesis. Statistics never prove one true.
- Replication: Landmark replication studies now find that a single significant result holds up only about a third of the time, so one study rarely settles a question.
References
Meehl, P. E. (1978). Theoretical risks and tabular asterisks: Sir Karl, Sir Ronald, and the slow progress of soft psychology. Journal of Consulting and Clinical Psychology, 46(4), 806–834. https://doi.org/10.1037/0022-006X.46.4.806
Open Science Collaboration. (2015). Estimating the reproducibility of psychological science. Science, 349(6251), aac4716. https://doi.org/10.1126/science.aac4716
Scheel, A. M., Schijen, M. R. M. J., & Lakens, D. (2021). An excess of positive results: Comparing the standard psychology literature with registered reports. Advances in Methods and Practices in Psychological Science, 4(2). https://doi.org/10.1177/25152459211007467
Simmons, J. P., Nelson, L. D., & Simonsohn, U. (2011). False-positive psychology: Undisclosed flexibility in data collection and analysis allows presenting anything as significant. Psychological Science, 22(11), 1359–1366. https://doi.org/10.1177/0956797611417632