Intelligence in psychology refers to the mental capacity to learn from experiences, adapt to new situations, understand and handle abstract concepts, and use knowledge to manipulate one’s environment. It includes skills such as problem-solving, critical thinking, learning quickly, and understanding complex ideas.
Key Takeaways
- Many Theories: defining and classifying intelligence is complicated. Theories range from one general intelligence (g) to certain primary mental abilities and multiple category-specific intelligences.
- IQ Testing: since the Binet-Simon scale of the early 1900s, intelligence quotient (IQ) tests have become the most widely known and used measure of intelligence.
- Test Flaws: IQ tests are generally reliable and valid, but they reflect Western cultural assumptions and can evoke stereotype threat and self-fulfilling prophecies.
- Normal Distribution: IQ scores are normally distributed, meaning 95% of the population scores between 70 and 130. Some extreme examples do fall far outside that range.
- Hierarchy: researchers largely accept a general factor above broader and narrower abilities, but still disagree about what the general factor is.
- Genes and Environment: heritability is substantial in adulthood, yet rearing environment and schooling still raise measured IQ.

What Is Intelligence?
We have all heard the word “intelligence” hundreds of times, so defining it can seem pointless. Yet psychologists have debated its meaning for decades.
Three broad approaches drive most of the disagreement:
- Biological: intelligence is successful adaptation to the environment.
- Psychometric: intelligence is measured through IQ tests that capture individual differences, focusing on the structure of ability.
- Information-processing: the question is not how much ability someone has, but what mental steps they take to solve a problem.
Intelligence has been defined in many ways: higher level abilities (such as abstract reasoning, mental representation, problem solving, and decision making), the ability to learn, emotional knowledge, creativity, and adaptation to meet the demands of the environment effectively.
Psychologist Robert Sternberg defined intelligence as “the mental abilities necessary for adaptation to, as well as shaping and selection of, any environmental context” (1997, p. 1).
Definitions differ widely. Terman and Burt stress purely cognitive ability. Binet, Wechsler, and Sternberg take a broader view, closer to common sense.
| Author | Definition |
|---|---|
| Binet and Simon (1905) | “a fundamental faculty … called judgement … good sense, practical sense, initiative, the faculty of adapting one’s self to circumstances” |
| Terman (1921) | “An individual is intelligent in proportion as he is able to carry on abstract thinking” |
| Wechsler (1944) | “the aggregate or global capacity of the individual to act purposefully, to think rationally, and to deal effectively with his environment” |
| Burt (1955) | “innate, general, cognitive ability” |
| Gottfredson (1998) | “the ability to deal with cognitive complexity” |
The most famous definition is also the most circular: intelligence is what intelligence tests measure (Boring, 1923). Circular as it sounds, it turns a conceptual dispute into an empirical one. The way test scores correlate limits which theories can be true.
History of Intelligence
Intelligence research began in the late 1800s. Sir Francis Galton, the cousin of Charles Darwin, was one of the first to study intelligence.
Galton was interested in the concept of a gifted individual, so he created a lab to measure reaction times and other physical characteristics. His hypothesis: intelligence is a general mental ability shaped by biological evolution (hello, Darwin!).
Galton theorized that because quickness and other physical attributes were evolutionarily advantageous, they would also provide a good indication of general mental ability (Jensen, 1982).
Thus, Galton operationalized intelligence as reaction time.
Galton’s programme failed on its own terms: his reaction-time measures correlated poorly with real-world accomplishment. The idea was revived later, though, once researchers had better instruments and started linking reaction time to psychometric ability.
What survived was modest but real. Sheppard and Vernon (2008) reviewed half a century of research and put the typical correlation between reaction time and IQ at roughly −.2 to −.4. The sign is negative because faster responses go with higher scores.
The direction of cause remains open. Faster decisions may reflect more efficient neural transmission, better strategies, or simply more practice.
Operationalization is an important process in research. It involves defining an unmeasurable phenomenon, such as intelligence, in measurable terms, such as reaction time. This allows the concept to be studied empirically (Crowther-Heyck, 2005).
Galton’s study of intelligence in the laboratory setting paved the way for decades of future research and debate. Despite his failed method, two of his ideas outlasted it:
- Intelligence is general: a broad mental ability underlies many different tasks.
- Intelligence is measurable: like physical traits, mental faculties form a measurable distribution across a population (Galton, 1883).
Galton also theorized about the heritability of intelligence. Heritability is the share of the differences in people’s IQ scores that traces back to genetic differences, rather than to upbringing.
Nature and Nurture: The Genetics of Intelligence
Galton’s hunch that intelligence runs in families set off a debate lasting well over a century. How much of a person’s intelligence comes from genes, and how much from upbringing?
Psychologists test this by studying adopted children. An adopted child shares genes with their biological parents, but not an upbringing. They share an upbringing with their adoptive parents, but not genes.
Adoption Studies: Genes vs. Environment
The logic is simple.
Comparing an adopted child’s IQ with both sets of parents lets researchers estimate how much each ingredient matters. The Colorado Adoption Project did exactly this, tracking hundreds of adopted children from infancy.
What did the data show?
Birth mothers and the children they had placed for adoption turned out to be “just as similar” on verbal and spatial ability. They were as alike as parents and the children they raised themselves.
The same adopted children’s scores did not resemble their adoptive parents at all (Plomin & DeFries, 1998).
Environment still matters. Just not for individual differences.
In the Minnesota Transracial Adoption Study, Black children raised in their own, less advantaged homes averaged an IQ of around 90. Black children adopted into advantaged White families averaged 106, a 16-point gain (Scarr & Weinberg, 1976).
A follow-up found something stranger. Unrelated adopted siblings who closely resembled each other as young children saw that resemblance fade to almost nothing by adolescence. Biologically related siblings, meanwhile, stayed just as similar as before.
As children grow older, they increasingly choose their own friends and activities. Only genetically related family members tend to choose similar ones (Scarr & Weinberg, 1983).
Modern Genetic Evidence
A 2015 study revisited this question at a scale the classic adoption studies could not match.
- Aim: Kendler and colleagues (2015) tested whether the rearing environment causally affects cognitive ability. They used Sweden’s complete national population register instead of a small volunteer sample.
- Method: They compared IQ, from military conscription records, between siblings in one family: one reared by their biological parents, the other adopted away. The sample held 436 full-sibling and 2,341 half-sibling pairs.
- Results: Adopted siblings scored 4.41 IQ points higher than their home-reared full siblings. Each extra unit of the adoptive parent’s education added a further 1.71-point gain, and the half-sibling sample replicated the pattern.
- Conclusion: Rearing environment genuinely raises IQ in late adolescence, and adoptive parents’ education explained much of that gain (Kendler et al., 2015).
Does that boost last? A 30-year follow-up of Minnesota families found that it largely does not.
By early adulthood, environmental factors accounted for only about 8% of the variation in IQ. Heritability was estimated at .42 (Willoughby, McGue, Iacono, & Lee, 2021).
One criticism cuts across all of this evidence. Adoption agencies do not place children at random.
They screen and match families, which could artificially shrink the very correlations these studies measure (Kamin, 1981). A 2026 review revisited this concern with genetic data the original researchers lacked. It found the correction did not meaningfully change the classic findings (Willoughby, Edwards, & Lee, 2026).
Theories of Intelligence
Some researchers argue that intelligence is a general ability, whereas others make the assertion that intelligence comprises specific skills and talents. Psychologists contend that intelligence is genetic, or inherited, and others claim that it is largely influenced by the surrounding environment.
As a result, psychologists have developed several contrasting theories of intelligence as well as individual tests that attempt to measure this very concept.
Spearman’s General Intelligence (g)
General intelligence, also known as g factor, refers to a general mental ability that underlies multiple specific skills, including verbal, spatial, numerical, and mechanical ability. Charles Spearman proposed it in 1904.
The English psychologist used a statistical technique called factor analysis to arrive at his theory (Spearman, 1904). Factor analysis looks for patterns in how different test scores rise and fall together, to find a hidden factor shared across them.
Spearman applied this method to intelligence test scores.
People who did well in one area, such as mathematics, also tended to do well in other areas, such as distinguishing pitch (Spearman, 1904). That pattern held across many different skills.
Spearman attributed this correlation to a single underlying factor: general intelligence, or g. He also proposed a second factor.
This factor, s, covers an individual’s specific ability in one particular area (Spearman, as cited in Thomson, 1947). Together, these two factors, g and s, make up Spearman’s two-factor theory.

Spearman’s claim invited a direct test.
- Aim: Spearman (1904) set out to determine whether the various things people called intelligence reflected one underlying capacity or many independent ones.
- Method: He tested schoolchildren on several school subjects and separate measures like pitch discrimination, then examined how the scores correlated with each other.
- Results: Every test correlated positively with every other. Spearman called this the positive manifold: people who score well on one mental test tend to score well on the others.
- Conclusion: He concluded that every intellectual activity draws on a general factor (g) plus a specific factor (s) unique to that task.
The positive manifold has proven remarkably robust. But Spearman’s jump from a shared statistic to an inherited “mental energy” went beyond his data. The error is now called reification: treating a statistical summary as if it were a real thing in the head (Gould, 1981).
Sharing variance does not explain why tests correlate.
Thurstone’s Primary Mental Abilities
Thurstone (1938) challenged the concept of a g-factor. After analyzing data from 56 different tests, he identified several primary mental abilities rather than one general factor.
Thurstone’s model has seven primary mental abilities, described in the table below (Thurstone, as cited in Sternberg, 2003).
| Mental Ability | Description |
|---|---|
| Word Fluency | Ability to use words quickly and fluency in performing such tasks as rhyming, solving anagrams, and doing crossword puzzles. |
| Verbal Comprehension | Ability to understand the meaning of words, concepts, and ideas. |
| Numerical Ability | Ability to use numbers to quickly compute answers to problems. |
| Spatial Visualization | Ability to visualize and manipulate patterns and forms in space. |
| Perceptual Speed | Ability to grasp perceptual details quickly and accurately and to determine similarities and differences between stimuli. |
| Memory | Ability to recall information such as lists or words, mathematical formulas, and definitions. |
| Inductive Reasoning | Ability to derive general rules and principles from the presented information. |
Thurstone conceded the point himself. When he tested a broader, more typical sample of schoolchildren instead of narrow, high-achieving college students, the primary abilities turned out to be closely linked.
A second analysis of those links recovered a general factor after all (Thurstone, 1947). The narrow first sample had hidden the very correlations that produce g.
Gardner’s Multiple Intelligences
Following the work of Thurstone, American psychologist Howard Gardner built on the idea that intelligence takes multiple forms. He rejected a single intelligence. Instead, he argued that distinct, independent intelligences exist, each representing skills relevant to a different category.
Gardner (1983, 1987) initially proposed seven multiple intelligences: separate mental abilities that each work fairly independently of the others. They are linguistic, logical-mathematical, spatial, musical, bodily-kinesthetic, interpersonal, and intrapersonal. He has since added naturalist intelligence.

Most activities involve a combination of these intelligences. Dancing, for example, draws on both spatial and bodily-kinesthetic intelligence.
Gardner also suggests the theory helps explain concepts beyond intelligence itself, such as creativity and leadership.
The theory has widely captured the psychology community’s attention, especially in education. But is that claim true?
- Aim: Visser, Ashton, and Vernon (2006) tested whether Gardner’s eight intelligences are truly independent of one another.
- Method: Two hundred adults completed two tests for each of the eight intelligences. All sixteen scores were analyzed together.
- Results: A large general factor ran through the results. Cognitive intelligences such as linguistic and logical-mathematical loaded heavily onto it, while sensorimotor ones such as bodily-kinesthetic barely did.
- Conclusion: The eight intelligences are not independent. The cognitive ones behave like ordinary sub-factors within general intelligence, not separate intelligences (Visser, Ashton, & Vernon, 2006).
Gardner and Moran (2006) countered that paper-and-pencil tests unfairly force his theory into the psychometric mould it was built to reject. It also does not account for forms of intelligence beyond the ones Gardner lists (Sternberg, 2003).
Triarchic Theory of Intelligence
Just two years later, in 1985, Robert Sternberg proposed a three-category theory of intelligence, integrating components that were lacking in Gardner’s theory.
This theory is based on the definition of intelligence as the ability to achieve success based on your personal standards and your sociocultural context.
According to the triarchic theory, intelligence has three aspects: analytical, creative, and practical (Sternberg, 1985).
- Analytical intelligence, also referred to as componential intelligence, refers to intelligence that is applied to analyze or evaluate problems and arrive at solutions. This is what a traditional IQ test measures.
- Creative intelligence is the ability to go beyond what is given to create novel and interesting ideas. This type of intelligence involves imagination, innovation, and problem-solving.
- Practical intelligence is the ability that individuals use to solve problems faced in daily life when a person finds the best fit between themselves and the demands of the environment.
Adapting to the demands of the environment involves three strategies. You can use knowledge gained from experience to change yourself to suit the environment (adaptation). You can also change the environment to suit yourself (shaping), or find a new environment altogether (selection).
Practical intelligence carries the theory’s boldest claim: that it is genuinely separate from academic ability. That claim needed a real test.
- Aim: Sternberg and colleagues (2001) tested whether practical intelligence is truly separate from academic intelligence.
- Method: Eighty-five Kenyan children aged 12 to 15 in a rural village completed a test of tacit knowledge about local herbal medicines. They also took standard tests of reasoning, vocabulary, and school achievement.
- Results: Tacit knowledge scores showed no positive link to the academic measures. Several correlations were even negative, and they stayed negative with socioeconomic status controlled.
- Conclusion: Practical intelligence is a distinct skill that ordinary tests fail to capture. In some communities it may even trade off against academic performance (Sternberg et al., 2001).
The finding is not as clean as it looks. Children who spend more time learning practical skills at home may simply spend less time in school, which alone could explain the negative link.
Gottfredson (2003) went further. She argued that practical intelligence has never been shown to add real predictive power beyond g, the general factor.
Taken together, these competing theories show that intelligence is not a simple concept. Views differ sharply.
Spearman argued that intelligence is generalizable across many areas of life. Thurstone, Gardner, and Sternberg instead described it as a tree with many branches, each representing a specific form of intelligence.
A few more types of intelligence add further branches to that tree.
Emotional Intelligence
Emotional Intelligence is the “ability to monitor one’s own and other people’s emotions, to discriminate between different emotions and label them appropriately, and to use emotional information to guide thinking and behavior” (Salovey and Mayer, 1990).
Emotional intelligence is important in everyday life. We experience one emotion or another in nearly every moment.
You may not associate emotions with intelligence, but the two are closely related. Emotional intelligence refers to the ability to recognize the meaning of emotions and to reason and problem-solve using them (Mayer, Caruso, & Salovey, 1999).
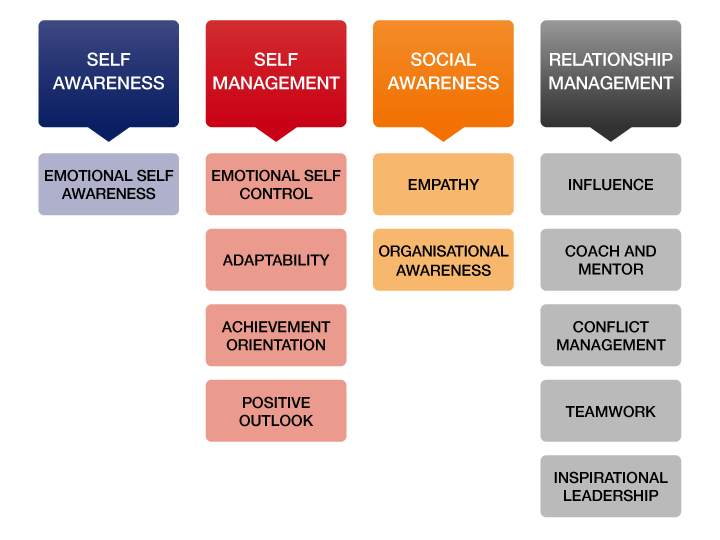
A popular competency model of emotional intelligence, associated with Daniel Goleman, lists four components (Goleman et al., 2002):
- Self-awareness: recognizing your own emotions as they happen.
- Self-management: regulating those emotions effectively.
- Social awareness: reading other people’s emotions accurately.
- Relationship management: using that awareness to guide interactions with others.
In short, someone high in emotional intelligence can accurately read emotions in themselves and others, such as facial expressions. They can also use emotions to help facilitate thinking and understand why they feel a certain way. They know how to manage their emotions too (Salovey & Mayer, 1990).
This ability model differs from the competency list above. Mayer, Caruso, and Salovey (1999) treat emotional intelligence as a set of performance tasks with correct answers. Scores correlate moderately with verbal ability and rise with age.
Whether the construct predicts outcomes beyond g and personality remains contested. Popular questionnaires also measure something substantially different from the ability model.
Fluid vs. Crystallized Intelligence
Raymond Cattell (1963) first proposed the concepts of fluid and crystallized intelligence and further developed the theory with John Horn.
Fluid intelligence is the ability to problem solve in novel situations without referencing prior knowledge, but rather through the use of logic and abstract thinking. Fluid intelligence can be applied to any novel problem because no specific prior knowledge is required (Cattell, 1963). As you grow older fluid increases and then starts to decrease in the late 20s.
Crystallized intelligence refers to the use of previously-acquired knowledge, such as specific facts learned in school or specific motor skills or muscle memory (Cattell, 1963). As you grow older and accumulate knowledge, crystallized intelligence increases.

The Cattell-Horn (1966) theory of fluid and crystallized intelligence suggests that intelligence is composed of a number of different abilities. These abilities interact and work together to produce overall individual intelligence.
Take a hard math test as an example. You rely on crystallized intelligence to process the numbers and meaning of the questions. But you may use fluid intelligence to work through the novel problem and arrive at the correct solution.
Fluid intelligence can even become crystallized intelligence. Novel solutions you create using fluid intelligence can, over time, develop into crystallized intelligence once they are incorporated into long-term memory.
This shows how different forms of intelligence overlap and interact, revealing its dynamic nature.
Carroll’s Three Strata and the CHC Model
Carroll (1993) reanalyzed more than 460 datasets from across the twentieth century. He used one common method so results could be compared. He found three strata:
- Stratum I: dozens of narrow abilities.
- Stratum II: around eight broad abilities, such as fluid reasoning, crystallized knowledge, and processing speed.
- Stratum III: a single general factor.
Merged with the Cattell-Horn tradition, this became the Cattell-Horn-Carroll (CHC) model, which now organizes most published ability tests. It treats g, Thurstone’s primary abilities, and fluid and crystallized intelligence as different levels of one hierarchy.
Yet CHC describes covariance without explaining it. The broad layer is not fixed by the data, either. Johnson and Bouchard (2005) fitted rival hierarchies to the same 42 tests, and a verbal-perceptual-image rotation model fitted best, ahead of the Cattell-Horn model.
Burt and Vernon’s Hierarchical Model
Hierarchical models reconcile a general factor with the group factors that Thurstone found.
Burt (1955) and Vernon (1950) kept a general factor but placed group factors between g and the specific skills. Each level has a clear meaning:
- General factor (g): what every test in a battery measures.
- Major group factors: verbal-educational and spatial-mechanical ability, each measured by some tests but not others.
- Minor group factors: narrower clusters, such as verbal fluency versus arithmetic.
- Specific factors: what one test measures on one occasion, mixed with error.
The model dominated British educational psychology for decades. Because g sat at the top and was assumed innate and fixed early, it licensed ranking every child on one scale at age eleven. That was the logic behind the eleven-plus examination.
The model itself did not require that policy. Moving from “a general factor exists” to “it is innate, fixed at eleven, and a fair basis for selection” adds claims that factor analysis cannot supply.
Comparing the Major Theories
The table sets the main theories side by side.
| Theory | Structure claimed | Principal evidence | Principal weakness |
|---|---|---|---|
| Spearman’s two factors | One general factor plus test-specific factors | The positive manifold | Cannot explain why tests correlate; g treated as innate energy |
| Thurstone’s primaries | Seven primary abilities | Simple-structure rotation of a 56-test battery | Independence came from range restriction; a general factor reappeared |
| Burt and Vernon | g above major and minor group factors | Reconciles the manifold with clustering | Descriptive; added policy assumptions were untested |
| Cattell-Horn | Fluid and crystallized functions within g | Fluid and crystallized scores follow different age patterns | Age evidence was cross-sectional; fluid tests are not fully culture-free |
| Carroll (CHC) | Three strata: narrow, broad, general | Reanalysis of 460+ datasets | Describes covariance but offers no mechanism |
| Sternberg’s triarchic theory | Analytical, creative, and practical intelligence | Culturally valued skills that tests miss | Distinctness and added predictive value of practical intelligence contested |
| Gardner’s multiple intelligences | Eight autonomous intelligences | Brain-damage dissociations, savants, prodigies | Cognitive domains load on a general factor |
The most defensible position is that the hierarchical structure is established: a general factor, broad group factors beneath it, and narrow abilities below those. What that structure means remains genuinely open.
Gardner and Sternberg are best read not as refuted rivals but as making a different kind of claim.
Psychometric structure, however well established, does not exhaust what is worth calling intelligence, because it says nothing about which competencies a culture needs. Factor analysis cannot settle that claim, which is why the debate persists.
Intelligence Testing
Binet-Simon Scale
During the early 1900s, the French government needed help. It asked psychologist Alfred Binet to identify which children were slower learners and required more classroom assistance (Binet et al., 1912).
Binet and his colleague, Theodore Simon, developed a set of questions. The questions focused on memory and problem-solving skills.
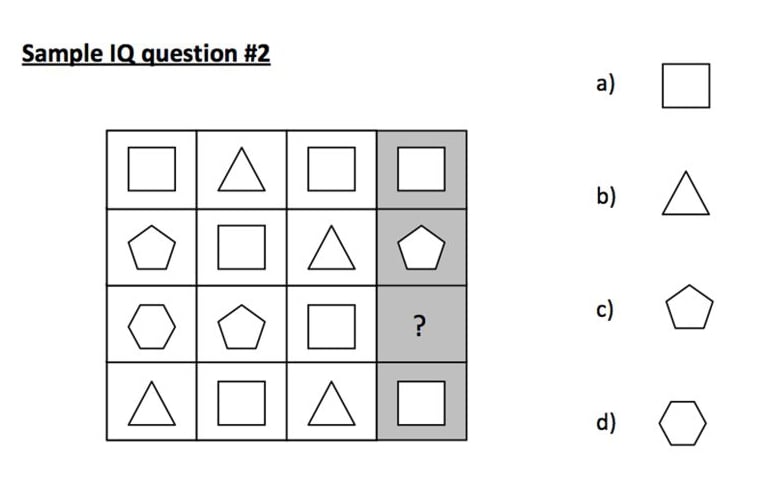
They tested these questions on students aged three to twelve to standardize the measure (Binet et al., 1912). Some younger children answered questions their older peers could not.
Binet used this to create the concept of mental age: how well a child performs intellectually relative to the average performance at that age (Cherry, 2020).
He eventually finalized the scale, known as the Binet-Simon scale, which became the basis for the intelligence tests still used today. The 1905 version comprised 30 items measuring judgment, comprehension, and reasoning, which Binet deemed the key characteristics of intelligence.
Stanford-Binet Intelligence Scale
When the Binet-Simon scale reached the United States, Stanford psychologist Lewis Terman adapted it for American students. He published the Stanford-Binet Intelligence Scale in 1916 (Terman, 1916).
Terman changed three things. He standardized the scale on a large American sample and extended it upward so adults could be scored. He also expressed results as a single ratio, an idea William Stern had proposed a few years earlier (Stern, 1912).
The third change mattered most.
Terman framed the resulting number as a measure of a stable, largely inherited capacity, useful for classifying and streaming children.
Binet refused that interpretation. He saw the scale as a tool for finding children who needed help. Those children, he argued, needed corrective teaching to raise their performance.
The Stanford-Binet Scale is a contemporary assessment. It measures intelligence across five features of cognitive ability: fluid reasoning, knowledge, quantitative reasoning, visual-spatial processing, and working memory. Both verbal and nonverbal responses are measured.

This test uses a single number, the intelligence quotient (IQ), to indicate a person’s score. The average score is 100, and any score from 90 to 109 counts as average intelligence.
Scores from 110 to 119 are High Average. Superior scores range from 120 to 129, and anything over 130 is Very Superior. That’s a wide range.
To calculate IQ, a student’s mental age is divided by their chronological age, and the result is multiplied by 100. A mental age equal to chronological age gives an IQ of 100, or average.
If your mental age is 12 but your chronological age is only 10, you will have an above-average IQ of 120.
This ratio had a flaw that eventually ended its use. Mental age stops growing in adolescence, while chronological age keeps rising. The ratio therefore drifts downward in adulthood for purely arithmetic reasons. Past the late teens it is meaningless.
Modern tests replaced the ratio with deviation scoring, as the WAIS section below explains.
WISC and WAIS
Just as theories of intelligence build on one another, so do intelligence tests.
After Terman created the Stanford-Binet test, American psychologist David Wechsler developed a new tool. He was dissatisfied with the Stanford-Binet’s limitations (Cherry, 2020).
Like Thurstone, Gardner, and Sternberg, Wechsler believed intelligence involved many different mental abilities. He felt the Stanford-Binet scale reflected the idea of one general intelligence too closely.
Wechsler saw the limits of his own instrument.
He resisted treating it as a pure measure of capacity. As Wechsler (1950) argued, drive, persistence, and interest shape how well people use their ability, yet tests miss them.
Because of this, Wechsler created two tests: the Wechsler Intelligence Scale for Children (WISC), published in 1949, and the Wechsler Adult Intelligence Scale (WAIS), published in 1955. A fifth edition (WAIS-5) followed in 2024. The description below covers the WAIS-IV, the edition behind most of the research cited here.
The WISC is an IQ test developed by David Wechsler. It measures intelligence and cognitive ability in children between the ages of 6 and 16. It is currently in its fifth edition (WISC-V), released in 2014 by Pearson.
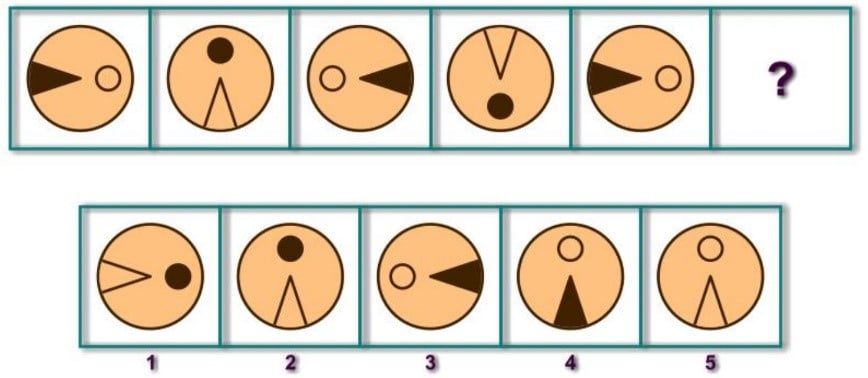
Above Image: WISC-IV Sample Test Question.
The WAIS measures cognitive ability in adults and older adolescents. It covers verbal comprehension, perceptual reasoning, working memory, and processing speed.
The scores paint a fuller picture.
The WAIS-IV was standardized on 2,200 healthy people between the ages of 16 and 90 years (Brooks et al., 2011). That’s a large sample.
Standardizing a test means giving it to a large number of people of different ages. This lets researchers compute the average score at each age level.
Every category counts.
The overall IQ score combines the test taker’s performance across all four categories (Cherry, 2020).
The WAIS does not calculate this number from mental and chronological age. It reports a deviation IQ: how far a score sits above or below the average for that person’s age group. That average comes from the standardization process.
This works at any age, because the comparison is with age peers rather than a developmental yardstick. It also makes IQ statistical. The scale is fixed by convention, so the same performance can earn different IQ numbers on tests with different spreads of scores.
Intelligence is a psychological concept, but IQ is a statistical one.
Group Tests: The Army Alpha and Beta
The Binet and Wechsler scales are individual tests: one examiner, one test taker, and an hour or more. That expense confined them largely to diagnosis. Group tests, printed, timed, and scored by key, turned testing into a mass technology.
The push came from war. In the First World War, American psychologists had to classify more than a million recruits. They built the Army alpha for literate recruits and the Army beta, a pictorial version, for those who could not read English (Yerkes, 1921).
The programme’s conclusions were compromised. Testing conditions were often chaotic, and the beta test still demanded literacy and schooling. Immigrants were tested on material saturated with American cultural knowledge.
Its institutional legacy was permanent all the same. The paper-and-pencil group test became the default instrument for educational and occupational selection.
The distinction still shapes practice:
- Individual tests: mainly diagnosis, where the examiner’s observations of how a person works are part of the data.
- Group tests: selection and research, where objectivity and throughput matter more.
The Flynn Effect
Test norms need regular updating. Measured intelligence in a population can drift over time.
James Flynn discovered this drift. It is now called the Flynn effect. Scores on intelligence tests have risen from decade to decade almost everywhere they have been tracked (Flynn, 1984).
The rise is too large to be real. Flynn (1987) found increases of up to roughly 20 points per generation on the most abstract, supposedly culture-free tests. Gains were far smaller on tests of school-taught knowledge.
Something else was changing fast. Intelligence itself was not.
Later meta-analyses confirm the rise. Trahan and colleagues (2014) pooled 285 studies in which the same people took two tests with different norms. Scores gained 2.31 points per decade, with no sign of the effect shrinking.
A larger synthesis added detail. Pietschnig and Voracek (2015) analyzed 271 samples and almost four million people from 1909 to 2013.
Gains were domain-specific: about 0.41 IQ points a year on fluid tests against 0.21 on crystallized ones. They were also falling in recent decades. The two reviews disagree on that trajectory.
Why does this matter? Wicherts and colleagues (2004) tested whether later cohorts simply have more of the general factor. In all five datasets, the link between subtests and the underlying ability had itself changed.
The gains are real, but IQ scores from different eras no longer mean quite the same thing.
Aptitude vs. Achievement Tests
Other tests, such as aptitude and achievement tests, are designed to measure intellectual capability.
Achievement tests measure what content a student has already learned, such as a unit test in history or a final math exam. That’s about mastery. An aptitude test instead measures a student’s potential or ability to learn (Anastasi, 1984).
Although this may sound similar to an IQ test, aptitude tests typically measure abilities in very specific areas.
Criticism of Intelligence Testing
Critics have long argued that IQ tests are biased in favor of white, middle-class people. Negative stereotypes about a person’s ethnicity, gender, or age may cause stereotype threat, a burden of doubt about their own abilities. This can create anxiety that results in lower scores.
Critics raise five main concerns about IQ testing:
- Reliability and validity: the tests are consistent, but predicting grades does not prove they measure intelligence.
- Cultural specificity: Western psychologists built the tests, and cultures define intelligence differently.
- Social and environmental factors: social threat and disadvantage can lower scores.
- Stereotype threat: fear of confirming a stereotype can depress performance.
- Self-fulfilling prophecy: teachers’ expectations may shape results, though the evidence is debated.
Reliability and Construct Validity
You may wonder whether retaking an intelligence test improves your score, or whether these tests even measure intelligence in the first place. Research offers reassurance: these tests are both reliable and have high construct validity.
Reliability means they are consistent over time.
If you take a test at two different points in time, there will be very little change in performance or, for intelligence tests, in IQ scores.
This isn’t a perfect science. Your score might fluctuate slightly across occasions or across different tests at the same age. Even so, IQ tests still demonstrate relatively high reliability (Tuma & Appelbaum, 1980).
Intelligence tests also reveal strong construct validity, meaning they are, in fact, measuring intelligence rather than something else.
That claim deserves scrutiny. Borsboom, Mellenbergh, and van Heerden (2004) set a stricter test for validity. A test is valid for a trait only if that trait genuinely exists and causes the scores, not merely if the scores predict something useful.
On this view, showing that IQ tests predict school grades proves only that. It does not prove the test measures intelligence itself.
A second problem is what kind of number an IQ is. Unlike height, an IQ has no true zero and is defined only by comparison with a reference group.
Nobody has shown that the gap between 100 and 110 equals the gap between 130 and 140. Michell (1997) pressed the deeper point. Psychometrics assumes that psychological attributes are quantitative, then measures them without testing that assumption.
Researchers have spent hours developing, standardizing, and adapting these tests to fit the current times. That is not to say the tests are flawless.
Research documents errors in the specific scoring of tests and the interpretation of the multiple scores an individual receives alongside their overall IQ score. Some studies question the actual validity, reliability, and utility of these tests for individual clinical use (Canivez, 2013).
Tests are built to reflect different theories of intelligence. Interpretations may therefore depend heavily on the theory behind a given test (Canivez, 2013).
Bifactor analyses of the WAIS-IV show the problem. The general factor accounts for most of the reliable common variance. The index scores clinicians interpret carry little reliable unique variance once g is removed (Gignac & Watkins, 2013). A jagged profile may often reflect measurement error.
Cultural Specificity
There are issues with intelligence tests beyond looking at them in a vacuum.
These tests were created by Western psychologists. They were built to measure Eurocentric values. Yet most of the world’s population does not live in Europe or North America.
So the cultural specificity of these tests matters. Different cultures hold different values and even different perceptions of intelligence, so is it fair to have one universal marker of this complex concept?
Definitions of intelligence vary across and within cultures:
- Kenya: parents defined intelligence as doing what needed doing around the homestead without being told (Harkness et al., 1992).
- Uganda: given the American and European emphasis on speed, some define intelligent people as slow in thought and action (Wober, 1974).
- San Jose, California: Latino, Asian, and Anglo parents held different definitions. Teachers’ views matched the Asian and Anglo parents’ more closely, and that match predicted children’s school performance (Okagaki & Sternberg, 1993).
These examples show how flexible intelligence is as a concept. Capturing it in a single test, let alone a single number, becomes even more challenging.
Culture-fair tests try to solve this problem.
Raven’s progressive matrices, for example, ask test takers to complete abstract figural patterns that need no reading or school knowledge (Raven, 1941). They reduced cultural loading but did not remove it.
Format is itself cultural. Working alone, working at speed, and treating a wordless puzzle as having one right answer are habits learned in school. And the supposedly culture-free matrix tests show the steepest rises across generations (Flynn, 1987).
Cole and colleagues (1971) showed a deeper problem.
Adult Kpelle participants in Liberia sorted familiar objects into functional groups, pairing a knife with an orange. They explained that a wise person would sort this way.
Asked how a foolish person would sort, they produced the taxonomic piles that the researchers had scored as more advanced. They had the skill. They simply judged that a different skill was called for.
Intelligence takes many forms. It ranges from country to country and culture to culture. Although IQ tests might have high reliability and validity, culture matters just as much, if not more, in the bigger picture of a person’s intelligence.
Not everything varies, though.
- Aim: Warne and Burningham (2019) tested whether a general factor appears in cognitive test data from non-Western, non-industrialized nations.
- Method: They searched for datasets from such nations and factor-analyzed 97 samples from 31 countries, totaling 52,340 people.
- Results: A single factor emerged from 71 samples, and 23 of the remaining 26 produced one at a second-order level. The first factor explained about 46% of the variance, close to Western samples.
- Conclusion: The positive manifold is not an artifact of Western schooling or test construction (Warne & Burningham, 2019).
That does not make the content of intelligent behavior universal. IQ tests may accurately measure academic intelligence, but more research is needed to show whether they capture practical intelligence in every culture.
Social and Environmental Factors
Another important part of the puzzle is social and environmental context. It shapes the IQ-test biases a person experiences. These might help explain why some people score lower than others.
For example, the threat of social exclusion can greatly decrease the expression of intelligence.
A 2002 study gave participants an IQ test and a personality inventory. The setup was simple.
Some were randomly chosen to receive feedback claiming they were “the sort of people who would end up alone in life” (Baumeister et al., 2002).
After a second test, those told they would be loveless and friendless in the future answered significantly fewer questions than they had on the earlier test.
This was a single small laboratory study, and its findings have not been replicated. That gap matters. Whether social or physical threats truly lower performance outside the lab remains untested, and one experiment cannot settle a claim this broad.
In other words, a child’s poor academic performance can be attributed to the disadvantaged, potentially unsafe communities in which they grow up.
Stereotype Threat
Stereotype threat is a phenomenon in which people feel at risk of conforming to stereotypes about their social group. Negative stereotypes can create anxiety that results in lower scores.
- Aim: Steele and Aronson (1995) tested whether making a negative stereotype salient lowers the test performance of the group it targets.
- Method: Black and White undergraduates took a difficult verbal test drawn from the Graduate Record Exam. Some were told it diagnosed intellectual ability, making the stereotype that Black students are less intelligent salient.
- Results: When the test was framed as diagnostic, Black students performed worse than White students matched on prior scores. In the non-diagnostic condition, the two groups performed equally well.
- Conclusion: Making a negative stereotype salient can depress the test performance of the stereotyped group (Steele & Aronson, 1995).
Even just recording your race can worsen performance. Stereotype threat is real, and it can hurt an individual’s performance on these tests.
More recent, larger reviews have shrunk this picture considerably. Shewach, Sackett, and Quint (2019) found the effect was much smaller under realistic testing conditions, and close to zero in some of them.
Self-Fulfilling Prophecy
Stereotype threat is closely related to a self-fulfilling prophecy. In this pattern, an individual’s expectations about another person can cause that person to act in ways that confirm the expectation.
In one experiment, students at a California elementary school were given an IQ test. Teachers then received the names of students who would supposedly become “intellectual bloomers” that year, based on the results (Rosenthal & Jacobson, 1968). The test was identical.
At the end of the study, students were tested again with the same IQ test. Those labeled “intellectual bloomers” significantly increased their scores.
This suggests teachers may subconsciously behave in ways that encourage certain students’ success, influencing their achievement (Rosenthal & Jacobson, 1968). It is another example of a small variable shaping both an individual’s intelligence score and the development of their intelligence.
That finding has been debated ever since. Critics have questioned both the study’s methods and how large its real effect was.
It is worth considering the less visible factors that shape someone’s intelligence.
An IQ score has real benefits for measuring intelligence. But a lower score does not necessarily mean someone is lower in intelligence.
Many factors can worsen performance on these tests, and the tests themselves might not even accurately measure the very concept they are meant to.
Extremes of Intelligence
IQ scores are generally normally distributed (Moore et al., 2013). Roughly 95% of the population has IQ scores between 70 and 130.
What about the other 5 percent? Individuals who fall outside this range represent the extremes of intelligence. These are life’s outliers.
Three groups sit at the extremes of intelligence:
- Giftedness: an IQ above 130 is considered gifted (Lally & French, 2018). Christopher Langan, an American horse rancher, has an IQ of around 200 (Gladwell, 2008).
- Intellectual disability: scores below 70 come with substantial developmental delays that affect motor skills, cognition, and speech (De Ligt, 2012).
- Savant syndrome: despite significant mental disabilities, savants show abilities far above average in specific fields, such as memorization, rapid calculation, or musical talent (Treffert, 2009).
Some intellectual disabilities stem from genetic mutations. Down syndrome, for example, results from an extra copy of the 21st chromosome and is a common genetic cause. Many individuals with Down syndrome have below-average IQ scores as a result (Breslin, 2014).
Savants may lack skills in areas such as social interaction and communication. Yet they excel remarkably elsewhere. This further illustrates the complexity of intelligence, and why we must consider all individuals when we measure and define it in society.
Intelligence Today
Today, intelligence is generally understood as the ability to understand and adapt to the environment, using both inherited abilities and learned knowledge.
New tests keep appearing. One example is the University of California Matrix Reasoning Task, which can be taken online in very little time (Pahor et al., 2019). New methods of scoring these tests have been developed too (Sansone et al., 2014).
Admission into university and graduate school relies on specific aptitude and achievement tests, such as the SAT, ACT, and LSAT. These tests have become a huge part of our lives.
Humans are incredibly intelligent beings. We rely on our intellectual abilities daily.
Intelligence can be defined and measured in countless ways. Yet our overall intelligence as a species makes us unique, and has allowed us to thrive for generations.
Critical Evaluation
Two problems run through every theory covered so far. Showing that test scores correlate does not explain why they correlate. A shared statistical factor is not automatically a single thing inside the head. Gould (1981) called this mistake reification, treating a number as if it were a real, physical capacity.
Three rival accounts explain why tests correlate. All reproduce the same pattern of correlations:
- Sampling (bonds): each test taps a subset of a vast pool of independent neural elements, so overlap creates correlation (Bartholomew et al., 2009).
- Mutualism: initially unrelated abilities boost each other’s growth over development, producing positive correlations (van der Maas et al., 2006).
- Process overlap: many tests draw on shared executive processes, so g emerges from the overlap (Kovacs & Conway, 2016).
The data cannot yet tell these accounts apart. The structure of intelligence is settled; its interpretation is not.
Prediction is real, but it is often oversold. IQ scores do predict school grades, job performance, and health outcomes.
A meta-analysis of 240 independent samples (105,185 students) found a corrected correlation of .54 between intelligence and school grades (Roth et al., 2015). That is substantial. It still leaves most of the variation in grades unexplained.
The job-performance link is weaker than long claimed.
Sackett and colleagues (2022) showed that earlier estimates overcorrected for range restriction, the shrinkage in correlations that occurs when a sample covers only part of the ability range.
Corrected validities are substantially lower, and cognitive ability tests no longer rank first among selection methods. Structured interviews and job-knowledge tests do comparatively better. Some researchers contest the revision, and ability tests still predict performance.
But test performance is not a pure readout of ability. Effort matters too.
Segal (2012) studied a low-stakes test, one where nothing depended on doing well. Scores on it still predicted people’s later earnings once measured ability was held constant. Motivation, not just capacity, was doing some of the work.
Test scores also miss important kinds of thinking.
Stanovich and West (2008) gave large student samples classic judgment tasks alongside measures of cognitive ability. Some biases correlated modestly with ability. Several of the most consequential, including myside bias (judging evidence in a one-sided way), were essentially independent of it.
Complex expertise can also hide from IQ tests. Ceci and Liker (1987) studied expert racetrack handicappers. The most successful used a demanding multiplicative strategy, weighing higher-order interactions among many variables. Yet their skill was unrelated to their IQ scores, and some scored below average.
Both findings have limits.
The handicapper sample was small and self-selected, and it covers a single niche. Still, they show that the capacity to compute and the disposition to compute well are separable.
Contemporary Research
Genetics has now entered the picture directly.
- Aim: Savage and colleagues (2018) searched for the specific genes linked to differences in general cognitive ability.
- Method: A genome-wide meta-analysis pooled data from 14 cohorts and 269,867 people. The researchers then checked which genes the associated variants pointed to.
- Results: Over 200 gene regions were linked to intelligence. Most sat in genes active in brain tissue involved in learning and memory.
- Conclusion: Cognitive ability has a highly polygenic basis, and the implicated genes converge on real neurobiology, not random noise (Savage et al., 2018).
Four limits matter. Cognitive measures differed across cohorts, which blurs distinctions such as fluid versus crystallized ability. The samples were overwhelmingly of European ancestry, so genetic scores predict poorly in other populations. Each variant’s effect is minute.
And association is not mechanism. Even so, the study shows that g is not merely an artifact of how tests are built.
That specific skill resists training. Melby-Lervåg, Redick, and Hulme (2016) pooled 145 comparisons of working-memory training programmes. Trainees improved on the trained tasks themselves. Their gains did not transfer to reading, arithmetic, or general reasoning.
Education tells a different story. Ritchie and Tucker-Drob (2018) combined three separate kinds of natural experiment, including school-entry cut-off dates and compulsory-schooling law changes, across more than 600,000 people.
An extra year of schooling raised measured intelligence by roughly one to five IQ points, and the gain held up across every method they tried.
Training the skill directly does little. Simply staying in school longer does more.
References
Anastasi, A. (1984). 7. Aptitude and Achievement Tests: The Curious Case of the Indestructible Strawperson.
Bartholomew, D. J., Deary, I. J., & Lawn, M. (2009). A new lease of life for Thomson’s bonds model of intelligence. Psychological Review, 116(3), 567–579. https://doi.org/10.1037/a0016262
Baumeister, R. F., Twenge, J. M., & Nuss, C. K. (2002). Effects of social exclusion on cognitive processes: anticipated aloneness reduces intelligent thought. Journal of personality and social psychology, 83 (4), 817.
Binet, A., & Simon, T. (1905). Méthodes nouvelles pour le diagnostic du niveau intellectuel des anormaux [New methods for the diagnosis of the intellectual level of subnormals]. L’Année Psychologique, 11, 191–244.
Binet, A., Simon, T., & Simon, T. (1912). A method of measuring the development of the intelligence of young children. Chicago medical book Company.
Boring, E. G. (1923). Intelligence as the tests test it. New Republic, 36, 35–37.
Borsboom, D., Mellenbergh, G. J., & van Heerden, J. (2004). The concept of validity. Psychological Review, 111(4), 1061–1071. https://doi.org/10.1037/0033-295X.111.4.1061
Breslin, J., Spanò, G., Bootzin, R., Anand, P., Nadel, L., & Edgin, J. (2014). Obstructive sleep apnea syndrome and cognition in Down syndrome. Developmental Medicine & Child Neurology, 56 (7), 657-664.
Brooks, B. L., Holdnack, J. A., & Iverson, G. L. (2011). Advanced clinical interpretation of the WAIS-IV and WMS-IV: Prevalence of low scores varies by level of intelligence and years of education. Assessment, 18 (2), 156-167.
Burt, C. (1955). The evidence for the concept of intelligence. British Journal of Educational Psychology, 25(3), 158–177. https://doi.org/10.1111/j.2044-8279.1955.tb03305.x
Canivez, G. L. (2013). Psychometric versus actuarial interpretation of intelligence and related aptitude batteries.
Carroll, J. B. (1993). Human cognitive abilities: A survey of factor-analytic studies. Cambridge University Press.
Cattell, R. B. (1963). Theory of fluid and crystallized intelligence: A critical experiment. Journal of educational psychology, 54 (1), 1.
Ceci, S. J., & Liker, J. K. (1987). A day at the races: A study of IQ, expertise, and cognitive complexity. Journal of Experimental Psychology: General, 116(2), 90–106. https://doi.org/10.1037/0096-3445.116.2.90
Cherry, K. (2020). Why Alfred Binet Developed IQ Testing for Students. Retrieved from https://www.verywellmind.com/history-of-intelligence-testing-2795581
Cole, M., Gay, J., Glick, J. A., & Sharp, D. W. (1971). The cultural context of learning and thinking: An exploration in experimental anthropology. Basic Books.
Crowther-Heyck, H. (2005). Herbert A. Simon: The bounds of reason in modern America. JHU Press.
De Ligt, J., Willemsen, M. H., Van Bon, B. W., Kleefstra, T., Yntema, H. G., Kroes, T., … & del Rosario, M. (2012). Diagnostic exome sequencing in persons with severe intellectual disability. New England Journal of Medicine, 367 (20), 1921-1929.
Flynn, J. R. (1984). The mean IQ of Americans: Massive gains 1932 to 1978. Psychological Bulletin, 95 (1), 29.
Flynn, J. R. (1987). Massive IQ gains in 14 nations: What IQ tests really measure. Psychological Bulletin, 101(2), 171–191. https://doi.org/10.1037/0033-2909.101.2.171
Galton, F. (1883). Inquiries into human faculty and its development. Macmillan. https://doi.org/10.1037/14178-000
Gardner, H. (1983). Frames of Mind. New York: Basic Books.
Gardner, H. (1987). The theory of multiple intelligence. Annals Of Dyslexia, 37, 19-35
Gardner, H., & Moran, S. (2006). The science of multiple intelligences theory: A response to Lynn Waterhouse. Educational Psychologist, 41(4), 227–232. https://doi.org/10.1207/s15326985ep4104_2
Gignac, G. E., & Watkins, M. W. (2013). Bifactor modeling and the estimation of model-based reliability in the WAIS-IV. Multivariate Behavioral Research, 48 (5), 639-662.
Gladwell, M. (2008). Outliers: The story of success. Little, Brown.
Goleman, D., Boyatzis, R., & McKee, A. (2002). Primal leadership: Realizing the power of emotional intelligence. Harvard Business School Press.
Gottfredson, L. S. (1998). The general intelligence factor. Scientific American Presents, 9(4), 24–29.
Gottfredson, L. S. (2003). Dissecting practical intelligence theory: Its claims and evidence. Intelligence, 31(4), 343–397. https://doi.org/10.1016/S0160-2896(02)00085-5
Gould, S. J. (1981). The mismeasure of man. Norton.
Harkness, S., Super, C., & Keefer, C. (1992). Culture and ethnicity. In M. Levine, W. Carey & A. Crocker (Eds.), Developmental-behavioral pediatrics (pp. 103-108).
Horn, J. L., & Cattell, R. B. (1966). Refinement and test of the theory of fluid and crystallized general intelligences. Journal of Educational Psychology, 57, 253-270.
Jensen, A. R. (1982). Reaction time and psychometric g. In A model for intelligence (pp. 93-132). Springer, Berlin, Heidelberg.
Johnson, W., & Bouchard, T. J., Jr. (2005). The structure of human intelligence: It is verbal, perceptual, and image rotation (VPR), not fluid and crystallized. Intelligence, 33(4), 393–416. https://doi.org/10.1016/j.intell.2004.12.002
Kamin, L. J. (1981). Studies of intelligence. In H. J. Eysenck & L. J. Kamin, The intelligence controversy: H. J. Eysenck versus Leon Kamin. John Wiley & Sons.
Kendler, K. S., Turkheimer, E., Ohlsson, H., Sundquist, J., & Sundquist, K. (2015). Family environment and the malleability of cognitive ability: A Swedish national home-reared and adopted-away cosibling control study. Proceedings of the National Academy of Sciences, 112(15), 4612–4617. https://doi.org/10.1073/pnas.1417106112
Kovacs, K., & Conway, A. R. A. (2016). Process overlap theory: A unified account of the general factor of intelligence. Psychological Inquiry, 27(3), 151–177. https://doi.org/10.1080/1047840X.2016.1153946
Lally, M., & French, S. V. (2018). Introduction to Psychology. Canada: College of Lake County Foundation, 176-212.
Mayer, J. D., Caruso, D. R., & Salovey, P. (1999). Emotional intelligence meets traditional standards for an intelligence. Intelligence, 27(4), 267-298.
Melby-Lervåg, M., Redick, T. S., & Hulme, C. (2016). Working memory training does not improve performance on measures of intelligence or other measures of “far transfer”: Evidence from a meta-analytic review. Perspectives on Psychological Science, 11(4), 512–534. https://doi.org/10.1177/1745691616635612
Michell, J. (1997). Quantitative science and the definition of measurement in psychology. British Journal of Psychology, 88(3), 355–383. https://doi.org/10.1111/j.2044-8295.1997.tb02641.x
Moore, D. S., Notz, W. I, & Flinger, M. A. (2013). The basic practice of statistics (6th ed.). New York, NY: W. H. Freeman and Company.
Okagaki, L., & Sternberg, R. J. (1993). Parental beliefs and children’s school performance. Child Development, 64 (1), 36-56.
Pahor, A., Stavropoulos, T., Jaeggi, S. M., & Seitz, A. R. (2019). Validation of a matrix reasoning task for mobile devices. Behavior Research Methods, 51 (5), 2256-2267.
Pietschnig, J., & Voracek, M. (2015). One century of global IQ gains: A formal meta-analysis of the Flynn effect (1909–2013). Perspectives on Psychological Science, 10(3), 282–306. https://doi.org/10.1177/1745691615577701
Plomin, R., & DeFries, J. C. (1998). The genetics of cognitive abilities and disabilities. Scientific American, 278(5), 62–69. https://doi.org/10.1038/scientificamerican0598-62
Raven, J. C. (1941). Standardization of progressive matrices, 1938. British Journal of Medical Psychology, 19(1), 137–150. https://doi.org/10.1111/j.2044-8341.1941.tb00316.x
Ritchie, S. J., & Tucker-Drob, E. M. (2018). How much does education improve intelligence? A meta-analysis. Psychological Science, 29(8), 1358–1369. https://doi.org/10.1177/0956797618774253
Rosenthal, R., & Jacobson, L. (1968). Pygmalion in the classroom. The urban review, 3 (1), 16-20.
Roth, B., Becker, N., Romeyke, S., Schäfer, S., Domnick, F., & Spinath, F. M. (2015). Intelligence and school grades: A meta-analysis. Intelligence, 53, 118–137. https://doi.org/10.1016/j.intell.2015.09.002
Sackett, P. R., Zhang, C., Berry, C. M., & Lievens, F. (2022). Revisiting meta-analytic estimates of validity in personnel selection: Addressing systematic overcorrection for restriction of range. Journal of Applied Psychology, 107(11), 2040–2068. https://doi.org/10.1037/apl0000994
Salovey, P., & Mayer, J. D. (1990). Emotional intelligence. Imagination, Cognition and Personality, 9 (3), 185-211.
Sansone, S. M., Schneider, A., Bickel, E., Berry-Kravis, E., Prescott, C., & Hessl, D. (2014). Improving IQ measurement in intellectual disabilities using true deviation from population norms. Journal of Neurodevelopmental Disorders, 6 (1), 16.
Savage, J. E., Jansen, P. R., Stringer, S., Watanabe, K., Bryois, J., de Leeuw, C. A., … & Posthuma, D. (2018). Genome-wide association meta-analysis in 269,867 individuals identifies new genetic and functional links to intelligence. Nature Genetics, 50(7), 912–919. https://doi.org/10.1038/s41588-018-0152-6
Scarr, S., & Weinberg, R. A. (1976). IQ test performance of Black children adopted by White families. American Psychologist, 31(10), 726–739. https://doi.org/10.1037/0003-066X.31.10.726
Scarr, S., & Weinberg, R. A. (1983). The Minnesota Adoption Studies: Genetic differences and malleability. Child Development, 54(2), 260–267. https://doi.org/10.2307/1129689
Segal, C. (2012). Working when no one is watching: Motivation, test scores, and economic success. Management Science, 58(8), 1438–1457. https://doi.org/10.1287/mnsc.1110.1509
Sheppard, L. D., & Vernon, P. A. (2008). Intelligence and speed of information-processing: A review of 50 years of research. Personality and Individual Differences, 44(3), 535–551. https://doi.org/10.1016/j.paid.2007.09.015
Shewach, O. R., Sackett, P. R., & Quint, S. (2019). Stereotype threat effects in settings with features likely versus unlikely in operational test settings: A meta-analysis. Journal of Applied Psychology, 104(12), 1514–1534. https://doi.org/10.1037/apl0000420
Spearman, C. (1904). “General intelligence,” objectively determined and measured. American Journal of Psychology, 15(2), 201–292. https://doi.org/10.2307/1412107
Stanovich, K. E., & West, R. F. (2008). On the relative independence of thinking biases and cognitive ability. Journal of Personality and Social Psychology, 94(4), 672–695. https://doi.org/10.1037/0022-3514.94.4.672
Steele, C. M., & Aronson, J. (1995). Stereotype threat and the intellectual test performance of African-Americans. Journal of Personality and Social Psychology, 69, 797-811.
Stern, W. (1912). Die psychologischen Methoden der Intelligenzprüfung und deren Anwendung an Schulkindern [The psychological methods of testing intelligence and their application to schoolchildren]. Barth.
Sternberg, R. J. (1985). Beyond IQ: A triarchic theory of human intelligence. CUP Archive.
Sternberg, R. J. (1997). The concept of intelligence and its role in lifelong learning and success. American psychologist, 52 (10), 1030.
Sternberg, R. J. (2003). Contemporary theories of intelligence. Handbook of psychology, 21-45.
Sternberg, R. J., Nokes, C., Geissler, P. W., Prince, R., Okatcha, F., Bundy, D. A., & Grigorenko, E. L. (2001). The relationship between academic and practical intelligence: A case study in Kenya. Intelligence, 29(5), 401–418. https://doi.org/10.1016/S0160-2896(01)00065-4
Terman, L. M. (1916). The measurement of intelligence: An explanation of and a complete guide for the use of the Stanford revision and extension of the Binet-Simon intelligence scale. Houghton Mifflin.
Terman, L. M. (1921). Intelligence and its measurement: A symposium—II. Journal of Educational Psychology, 12(3), 127–133. https://doi.org/10.1037/h0064940
Treffert, D. A. (2009). The savant syndrome: an extraordinary condition. A synopsis: past, present, future. Philosophical Transactions of the Royal Society B: Biological Sciences, 364 (1522), 1351-1357.
Thomson, G. (1947). Charles Spearman, 1863-1945.
Thurstone, L. L. (1938). Primary mental abilities. University of Chicago Press.
Thurstone, L. L. (1947). Multiple factor analysis. University of Chicago Press.
Trahan, L. H., Stuebing, K. K., Fletcher, J. M., & Hiscock, M. (2014). The Flynn effect: A meta-analysis. Psychological Bulletin, 140(5), 1332–1360. https://doi.org/10.1037/a0037173
Tuma, J. M., & Appelbaum, A. S. (1980). Reliability and practice effects of WISC-R IQ estimates in a normal population. Educational and Psychological Measurement, 40 (3), 671-678.
van der Maas, H. L. J., Dolan, C. V., Grasman, R. P. P. P., Wicherts, J. M., Huizenga, H. M., & Raijmakers, M. E. J. (2006). A dynamical model of general intelligence: The positive manifold of intelligence by mutualism. Psychological Review, 113(4), 842–861. https://doi.org/10.1037/0033-295X.113.4.842
Vernon, P. E. (1950). The structure of human abilities. Methuen.
Visser, B. A., Ashton, M. C., & Vernon, P. A. (2006). Beyond g: Putting multiple intelligences theory to the test. Intelligence, 34(5), 487–502. https://doi.org/10.1016/j.intell.2006.02.004
Warne, R. T., & Burningham, C. (2019). Spearman’s g found in 31 non-Western nations: Strong evidence that g is a universal phenomenon. Psychological Bulletin, 145(3), 237–272. https://doi.org/10.1037/bul0000184
Wechsler, D. (1944). The measurement of adult intelligence (3rd ed.). Williams & Wilkins.
Wechsler, D. (1950). Cognitive, conative, and non-intellective intelligence. American Psychologist, 5(3), 78–83. https://doi.org/10.1037/h0063112
Wicherts, J. M., Dolan, C. V., Hessen, D. J., Oosterveld, P., van Baal, G. C. M., Boomsma, D. I., & Span, M. M. (2004). Are intelligence tests measurement invariant over time? Investigating the nature of the Flynn effect. Intelligence, 32(5), 509–537. https://doi.org/10.1016/j.intell.2004.07.002
Willoughby, E. A., McGue, M., Iacono, W. G., & Lee, J. J. (2021). Genetic and environmental contributions to IQ in adoptive and biological families with 30-year-old offspring. Intelligence, 88, Article 101579. https://doi.org/10.1016/j.intell.2021.101579
Willoughby, E. A., Edwards, T., & Lee, J. J. (2026). Durable lessons on intelligence from twin and adoption research. Behavior Genetics. Advance online publication. https://doi.org/10.1007/s10519-026-10270-4
Wober, M. (1974). Towards an understanding of the Kiganda concept of intelligence. In J. W. Berry & P. R. Dasen (Eds.), Culture and cognition: Readings in cross-cultural psychology (pp. 261–280). Methuen.
Yerkes, R. M. (Ed.). (1921). Psychological examining in the United States Army. Memoirs of the National Academy of Sciences, 15.