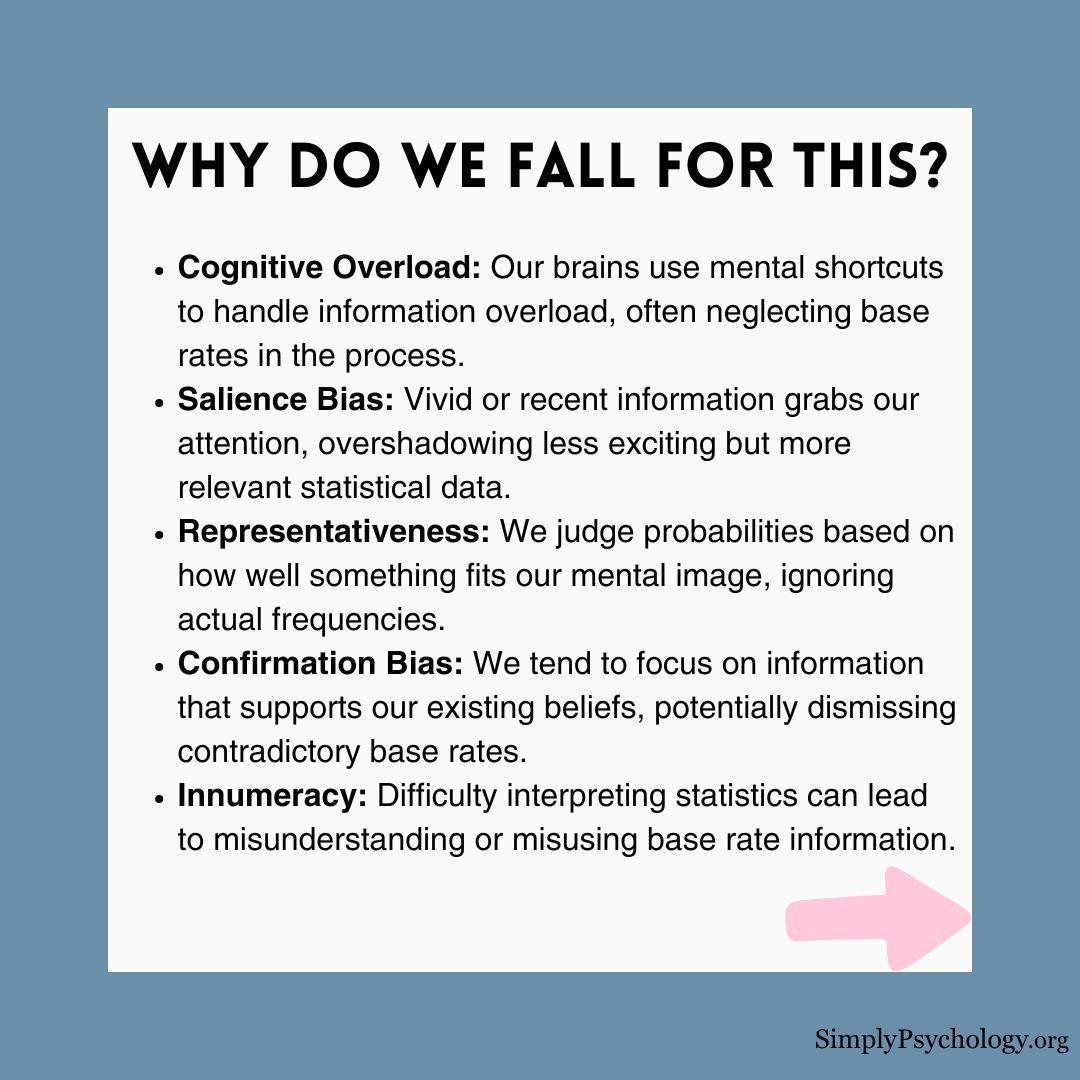
The base-rate fallacy, also known as base-rate neglect, is a cognitive bias where individuals ignore general statistical information in favor of specific, vivid details.
In psychology, base-rate information refers to the relative frequency of an event or attribute within a given population.
The correct method is Bayes’ theorem. It updates the probability of a hypothesis by weighing the prior probability (the base rate) against the new evidence.
Key Takeaways
- Definition: People under-weight how common an event is in a population when a vivid, specific description is available.
- Representativeness: Kahneman and Tversky traced the error to judging probability by how well a case matches a stereotype.
- Classic Evidence: In the taxi-cab and "Tom W." problems, people ignored population statistics they had been given.
- Expert Error: Harvard clinicians misjudged a rare-disease test. Of the sample, 45% answered 95% where the correct answer was about 2%.
- When It Fades: People use base rates when no description competes with them, or when the statistic comes with a causal story.
- Better Formats: Natural frequencies help, but a 2017 meta-analysis found most people still fail well-formatted problems.
Why the Base-Rate Fallacy Happens
Several psychological frameworks explain why the human mind struggles with statistical logic. These range from how we categorize people to how our brains conserve energy.
The Representativeness Heuristic
Psychologists Daniel Kahneman and Amos Tversky argue that this error stems from the representativeness heuristic.
This is a mental shortcut where people judge probability based on how well a description matches a mental prototype or stereotype.
This can lead to errors in judgment, as people do not take the time to process all of the available information and weigh it up properly.
Dual-Process Thinking
This bias serves as a primary example of the tension between two distinct modes of human thought.
System 1 is our fast, automatic, and intuitive processing mode. In contrast, System 2 is our slow, analytical, and effortful mode of reasoning.
Base-rate neglect occurs when the “lazy” System 2 fails to check System 1’s flawed suggestions.
System 1 leaps to conclusions from vivid details. System 2 must do the hard work of statistical integration.
If no descriptive details are provided, people use base rates accurately.
However, the moment distracting details appear, analytical thinking is often abandoned.
De Neys and Glumicic (2008) tested this directly. They gave participants base-rate problems in which the personality description either matched the base rate or conflicted with it.
Most participants still gave the stereotype-matching answer on conflicting problems. Yet they took reliably longer to respond, and they rarely mentioned the base rate when thinking aloud. The conflict registers, even when System 2 fails to resolve it.
The Natural Frequency Hypothesis
Psychologists Gerd Gigerenzer and Ulrich Hoffrage (1995) argue that humans are not “bad at math.”
Instead, they argue our brains evolved for natural sampling.
This is the process of encountering real-world instances one by one over time.
Our ancestors did not process abstract percentages or fractions.
Research shows that when base-rate problems use natural frequencies (e.g., “10 out of 100 people”) instead of percentages (e.g., “10%”), accuracy improves.
In Gigerenzer and Hoffrage’s (1995) experiments, correct answers rose sharply when identical problems used natural frequencies. In some studies, accuracy climbed from under 20% to around 50% or more.
Examples
The base-rate fallacy is a decision-making error. People ignore, or underweight, information about how often a trait occurs in a population (the base-rate information).
The fallacy often appears in our daily assumptions about the people we encounter.
-
The Subway Reader: If you see someone reading The New York Times on a subway, you might guess they have a PhD. However, statistically, there are vastly more people without college degrees on the subway than people with PhDs.
- The “Californian” Student: You might meet a blond, “mellow” student named Brian who loves the beach. While he fits a California stereotype, if the university has a much higher base rate of New Yorkers, it is statistically wiser to guess Brian is from New York.
-
Steve the Librarian: Steve is described as a “meek and tidy soul.” While this fits the librarian stereotype, there are significantly more male farmers in the population than male librarians.
Empirical Validation: Classic Experiments
The following studies demonstrate how this fallacy persists even when participants are given the correct statistical data.
1. The Taxi-Cab Problem (Kahneman & Tversky, 1972)
- Aim: To observe how participants weigh eyewitness testimony against known population statistics.
- Procedure: Participants imagined a city where 85% of cabs are Green and 15% are Blue. A witness identified a hit-and-run cab as "Blue" and was tested as 80% accurate.
- Findings: Most participants estimated the probability the cab was Blue at roughly 80%. They focused almost entirely on the witness and ignored the 85% base rate of Green cabs.
- Conclusions: People prioritize specific evidence over base rates. According to Bayesian logic, the true probability the cab was Blue is actually only 41%.
The error is not a failure to understand probability. Participants use base rates when nothing competes with them. What fails is combining vivid, individuating evidence with a dry statistic.
Counting cabs shows why. Of 100 cabs, 85 are Green and 15 are Blue. The witness correctly calls about 12 of the 15 Blue cabs. But the witness also wrongly calls about 17 of the 85 Green cabs Blue.
So only about 12 of the 29 "Blue" reports, or 41%, are correct.
2. The Student Stereotype (Tom W.) (Kahneman & Tversky, 1973)
- Aim: To test if people prioritize descriptive stereotypes over known population statistics.
- Procedure: Participants read a description of "Tom W," a student described as "dull," "neat," and "tidy." They were also told that the great majority of graduate students studied humanities and social sciences.
- Findings: Well over 90% of participants ranked computer science as more likely than fields with a far higher base rate. Their judgements barely shifted despite the explicit statistics.
- Conclusions: The description matched the computer scientist stereotype so perfectly that participants abandoned statistical logic.
A closely related task gave participants a description of a man named Jack. They were told the sample was either mostly engineers or mostly lawyers. Participants judged the probability that Jack was an engineer at around 0.90 on average, whether the sample was 70% engineers or 70% lawyers.
The explicit 70:30 base rate barely mattered. Judgements tracked the description alone.
Base rates did matter when no description was given. Asked about an undescribed member of the sample, participants used the stated proportion of engineers accurately (Kahneman & Tversky, 1973). Only a vivid, stereotype-matching description crowds the base rate out.
3. The Harvard Medical Problem (Casscells et al., 1978)
- Aim: To test whether trained clinicians use disease prevalence when interpreting a positive test result.
- Procedure: Harvard Medical School physicians, students and staff read a vignette: a disease affects 1 in 1,000 people, and the test has a 5% false-positive rate. They estimated the chance that a positive result means disease.
- Findings: The Bayesian answer is about 2%, but 45% of the sample answered 95%. Only about 18% gave roughly the correct answer.
- Conclusions: Base-rate neglect survives in numerate, professionally trained people facing a task with direct clinical stakes.
Counting people shows why 2% is right. Of 1,000 people, one has the disease and, if the test never misses a case, tests positive. About 50 healthy people also test positive. So only about 1 in 51 positive results is a true case.
These answers suggest participants treated the false-positive rate as the key figure and disregarded how rare the disease is.
4. Medical Diagnoses and Causal Context (Krynski & Tenenbaum, 2007)
- Aim: To investigate if providing a causal explanation helps people utilize base rates.
- Procedure: Participants judged the likelihood of cancer after a positive mammogram. One group received only the statistics; a second group was also told that "dense but harmless cysts" could cause a positive result.
- Findings: Accuracy jumped from 8% to 46% when the alternative causal explanation (the cyst) was provided.
- Conclusions: People neglect base rates when the relevance is unclear. They use them more effectively when the data maps to their intuitive causal knowledge.
How to Avoid the Base-Rate Fallacy
Four habits help you give base rates their proper weight:
-
Use Frequencies: Always translate percentages into raw counts to help visualize the actual numbers involved.
-
Identify Causes: Look for alternative explanations for the evidence that might explain the specific details you are seeing.
-
Think Like a Statistician: Deliberately engage System 2 by slowing down and questioning the “story” you are telling yourself.
-
Assess Evidence Quality: Recognize that if specific details are flimsy or stereotypical, you should let the base rate dominate your decision.
The Influence of Causal Context
Not all base rates are ignored equally.
The human mind is “hungry for causal stories,” meaning we prefer information that explains why something happened.
Statistical vs. Causal Base Rates
Kahneman and Tversky distinguished between two types of data. Statistical base rates are mere facts about a population that lack a narrative.
These are generally underweighted.
However, causal base rates change our view of how an individual case came to be.
For example, if you hear that 80% of accidents involve “Company A” drivers because they are reckless, you are more likely to use that data than a dry statistic.
The Role of Missing Context
Krynski and Tenenbaum (2007) argue that people ignore base rates primarily when their relevance is not explicitly clear.
Bare numbers give the mind no story to attach them to. Once the same numbers fit a plausible cause, people use them far more fully, even when the format of the numbers does not change.
The mammogram study above shows this. When participants learned that "harmless cysts" can also cause a positive result, accuracy jumped from 8% to 46%.
What looks like neglect may be sensible caution. Outside the laboratory, numbers rarely arrive without an explanation, so discounting an unexplained statistic can be a reasonable default. Humans reason better statistically when they have an intuitive causal model to follow.
Real-World Applications of the Base-Rate Fallacy
Base-rate neglect matters most where a decision hinges on a rare event. Medical screening, courtroom evidence and algorithmic risk scores all share the statistical structure of the classic vignettes.
Medical Diagnosis and Screening
A test for a rare condition can produce more false positives than true positives. Why? The false positives come from the far larger group of healthy people.
The Harvard problem above shows that even trained clinicians miss this (Casscells et al., 1978). Doctors who equate a positive result with a high probability of disease overestimate risk.
The consequences are real. They include unnecessary invasive follow-up, patient anxiety and treatment decisions based on inflated risk.
Natural frequencies offer a fix. Presenting test performance as counts, such as how many of 1,000 people who test positive actually have the disease, counteracts the bias. It is now a recommended communication practice for clinicians and patients alike (Gigerenzer & Hoffrage, 1995).
In the Harvard problem, that means saying that about 51 of every 1,000 people test positive, and only one has the disease.
Legal and Forensic Reasoning
Jurors, lawyers and even expert witnesses can neglect base rates when interpreting forensic evidence. DNA and fingerprint matches are typical cases.
The prosecutor’s fallacy treats the rarity of a matching profile in the general population as if it were the probability that the defendant is innocent. The logic fails.
This ignores how many innocent people could match by chance in a large population. It also ignores how many suspects were considered before the match was found. A rare profile is still shared by some innocent people. A match alone cannot establish guilt.
Dahlman (2023) lists the prosecutor’s fallacy among the probabilistic errors that fact-finders commit in real legal cases. The cost can be a wrongful conviction. It can equally be a wrongful acquittal.
Clinical and Forensic Risk Assessment
Base-rate reasoning is central to a long debate in psychological assessment. Are predictions about a person better made by a clinician’s unstructured judgement or by a statistical formula?
Meehl (1954) argued that actuarial methods tend to outperform intuitive synthesis. They give the relevant base rate its proper weight. A later meta-analysis (Grove et al., 2000) found that mechanical prediction equalled or beat clinical judgement in most comparisons across medicine and psychology.
One plausible reason is representativeness-driven neglect. A clinician who weighs a case’s vivid features over the outcome’s base rate repeats the error of a participant judging Tom W.
Actuarial risk tools are built to counter this.
Quinsey et al. (1995) illustrated the approach with a scale that predicts sexual recidivism from weighted predictors such as psychopathy and criminal history. Tools like this anchor parole and sentencing decisions to recidivism rates, not to a clinician’s case-by-case impression.
Risk Communication and Algorithms
Agencies communicating environmental, financial or public-health risk face the same problem. Framing that stresses a vivid worst case, without saying how rarely it occurs, produces overestimates of danger. Framing anchored in base rates and natural frequencies produces better-calibrated public judgements (Gigerenzer & Hoffrage, 1995).
Algorithms inherit the same structure. Even an accurate fraud-detection or screening algorithm will flag mostly false positives when the target event is rare. This is the false-positive paradox.
Treating a high-risk flag as a high probability of the outcome repeats the fallacy. The risk score plays the part of the vivid description. The population statistics are neglected.
The remedies developed for clinicians and jurors, natural frequencies and causal explanations, are increasingly recommended for presenting algorithmic outputs (Gigerenzer & Hoffrage, 1995; Krynski & Tenenbaum, 2007).
Critical Evaluation of Base-Rate Neglect Research
Critics raise three main concerns about the classic base-rate research:
- Artificial Vignettes: Wording and structure change how much people neglect base rates, so single-study estimates may be inflated.
- Ecological Rationality: Natural frequencies improve reasoning, so the error may reflect task format rather than a fixed flaw.
- Real-World Reach: Most evidence comes from low-stakes vignettes, so professionals in rich contexts may reason better.
Vignette Studies May Inflate the Error
Bar-Hillel (1980) showed that the size of base-rate neglect depends on how a problem is worded and structured. Two features matter most.
One is whether the base rate looks causally relevant to the individual case. The other is how directly it competes with the personal description.
The magnitude reported in any single study is therefore partly an artefact of the vignette used. It is not a fixed property of human cognition.
Later work points the same way. Gigerenzer and Hoffrage (1995) found that recasting mathematically identical problems as natural frequencies dramatically reduced the error. Krynski and Tenenbaum (2007) found that adding a causal explanation, with no change to the numerical format, had a similar effect.
Early estimates of human irrationality may therefore have been inflated. The classic problems were unrepresentatively difficult and artificially bare. This sensitivity to presentation links the fallacy to the framing effect.
The Ecological Rationality Debate
The heuristics-and-biases tradition (Kahneman & Tversky, 1972, 1973; Tversky & Kahneman, 1974) treats base-rate neglect as proof that intuition departs systematically from statistical rules.
Gigerenzer and Hoffrage (1995) disagreed. They argued that this verdict holds human cognition to a format it was never adapted to use.
Performance recovers substantially once information arrives as natural frequencies, the format that ancestral environments would have supplied.
The 2017 meta-analysis below partly settles the argument. Format change gives a large, replicable gain, which supports Gigerenzer’s core claim that presentation matters. Yet most participants still fail well-formatted problems. A purely ecological account struggles to explain this, because a mind tuned to frequencies should do well with them.
The balanced reading is that both camps are partly right. Format is a major moderator of the error, but not its only cause.
Lab Findings vs Real-World Reasoning
The practical stakes are well established. Base-rate neglect produces costly, patterned errors in medicine (Casscells et al., 1978), law (Dahlman, 2023) and risk communication (Gigerenzer & Hoffrage, 1995). That gives the research unusual applied credibility for a laboratory-derived bias.
Yet most of the founding evidence comes from artificial vignettes. Participants had no stake in the outcome, no colleagues to consult and no real causal context to draw on.
A working clinician reading a full patient history is in a very different position. So is a juror hearing a case argued at length.
Krynski and Tenenbaum’s (2007) finding matters here. If a causal explanation alone restores better use of base rates, professionals in causally rich settings may reason better than vignette studies imply.
The error still threatens judgements about unfamiliar, decontextualised statistics. A newly deployed algorithmic risk score is one example.
Contemporary Research
Recent evidence suggests that base-rate neglect is real and robust. It is neither fixed nor cured by a single format trick. The field now measures how much a format change helps.
Do Natural Frequencies Fix It?
McDowell and Jacobs (2017) ran a meta-analysis, which pools many studies to give a more reliable estimate than any single experiment. They combined 35 published studies and 226 performance estimates covering about twenty years of research.
- Aim: To measure how much natural-frequency formats improve Bayesian reasoning compared with probability formats.
- Method: A meta-analysis pooled 35 published studies and 226 performance estimates from about twenty years of research.
- Findings: Natural frequencies raised correct answers from about 4% to about 24%. Most participants still failed.
- Conclusion: Format helps substantially but is no complete fix. Problem structure and how the sets are presented also matter.
The result confirms Gigerenzer and Hoffrage’s (1995) claim that natural frequencies help. It also corrects how far. Roughly three-quarters of participants still failed.
The authors read this as evidence against a single-cause account. Moderators, such as how the problem’s sets are structured, work alongside format. No single presentational fix removes the error.
Probabilistic Fallacies in Court
Dahlman (2023) reviewed the named probabilistic fallacies that fact-finders commit in legal cases. He organised them into 12 fallacies across 7 categories. Each is precisely defined and illustrated with real cases.
The set includes the prosecutor’s fallacy, a close relative of base-rate neglect. It wrongly equates the rarity of a forensic match with the probability of innocence.
Taken together, these studies point towards better presentation formats combined with training suited to the decision context, whether medical, legal or algorithmic.
Conclusion: Bounded Rationality
While the base-rate fallacy leads to errors, it does not mean humans are fundamentally irrational.
Instead, we operate under bounded rationality, which is the idea that we make the best possible decisions given our cognitive limits.
Heuristics like representativeness are highly efficient in a complex world.
We only see their flaws in specific, laboratory-designed scenarios where abstract logic is prioritized over practical, everyday intuition.
References
Bar-Hillel, M. (1980). The base-rate fallacy in probability judgments. Acta Psychologica, 44 (3), 211-233.
Barbey, A. K., & Sloman, S. A. (2007). Base-rate respect: From ecological rationality to dual processes. Behavioral and Brain Sciences, 30 (3), 241-254.
Bar-Hillel, M. (1983). The base rate fallacy controversy. In Advances in Psychology (Vol. 16, pp. 39-61). North-Holland.
Casscells, W., Schoenberger, A., & Graboys, T. B. (1978). Interpretation by physicians of clinical laboratory results. New England Journal of Medicine, 299(18), 999–1001. https://doi.org/10.1056/NEJM197811022991808
Dahlman, C. (2023). A systematic account of probabilistic fallacies in legal fact-finding. The International Journal of Evidence & Proof, 28(1), 45–64. https://doi.org/10.1177/13657127231209019
De Neys, W., & Glumicic, T. (2008). Conflict monitoring in dual process theories of thinking. Cognition, 106, 1248–1299. https://doi.org/10.1016/j.cognition.2007.06.002
Gigerenzer, G., & Hoffrage, U. (1995). How to improve Bayesian reasoning without instruction: Frequency formats. Psychological Review, 102(4), 684–704.
Grove, W. M., Zald, D. H., Lebow, B. S., Snitz, B. E., & Nelson, C. (2000). Clinical versus mechanical prediction: A meta-analysis. Psychological Assessment, 12(1), 19–30. https://doi.org/10.1037/1040-3590.12.1.19
Heller, R. F., Saltzstein, H. D., & Caspe, W. B. (1992). Heuristics in medical and non-medical decision-making. The Quarterly Journal of Experimental Psychology Section A, 44 (2), 211-235.
Kahneman, D. (2011). Thinking, fast and slow. Farrar, Straus and Giroux.
Kahneman, D., Slovic, P., & Tversky, A. (Eds.). (1982). Judgment under uncertainty: Heuristics and biases. Cambridge University Press.
Kahneman, D., & Tversky, A. (1972). Subjective probability: A judgment of representativeness. Cognitive psychology, 3 (3), 430-454.
Kahneman, D., & Tversky, A. (1973). On the psychology of prediction. Psychological Review, 80(4), 237–251. https://doi.org/10.1037/h0034747
Koehler, J. J. (1996). The base rate fallacy reconsidered: Descriptive, normative, and methodological challenges. Behavioral and brain sciences, 19 (1), 1-17.
Krynski, T. R., & Tenenbaum, J. B. (2007). The role of causality in judgment under uncertainty. Journal of Experimental Psychology: General, 136(3), 430–450. https://doi.org/10.1037/0096-3445.136.3.430
Macchi, L. (1995). Pragmatic aspects of the base-rate fallacy. The Quarterly Journal of Experimental Psychology, 48 (1), 188-207.
McDowell, M., & Jacobs, P. (2017). Meta-analysis of the effect of natural frequencies on Bayesian reasoning. Psychological Bulletin, 143(12), 1273–1312. https://doi.org/10.1037/bul0000126
Meehl, P. E. (1954). Clinical versus statistical prediction: A theoretical analysis and a review of the evidence. University of Minnesota Press.
Quinsey, V. L., Rice, M. E., & Harris, G. T. (1995). Actuarial prediction of sexual recidivism. Journal of Interpersonal Violence, 10(1), 85–105. https://doi.org/10.1177/088626095010001006
Tversky, A., & Kahneman, D. (1973). Availability: A heuristic for judging frequency and probability. Cognitive psychology, 5(2), 207-232.
Tversky, A., & Kahneman, D. (1974). Judgment under uncertainty: Heuristics and biases. Science, 185(4157), 1124–1131.