The electroencephalogram (EEG) is a non-invasive neuroimaging test that detects and records tiny changes in electrical activity within the brain. This activity is picked up using electrodes: small, flat metal discs attached to the scalp.
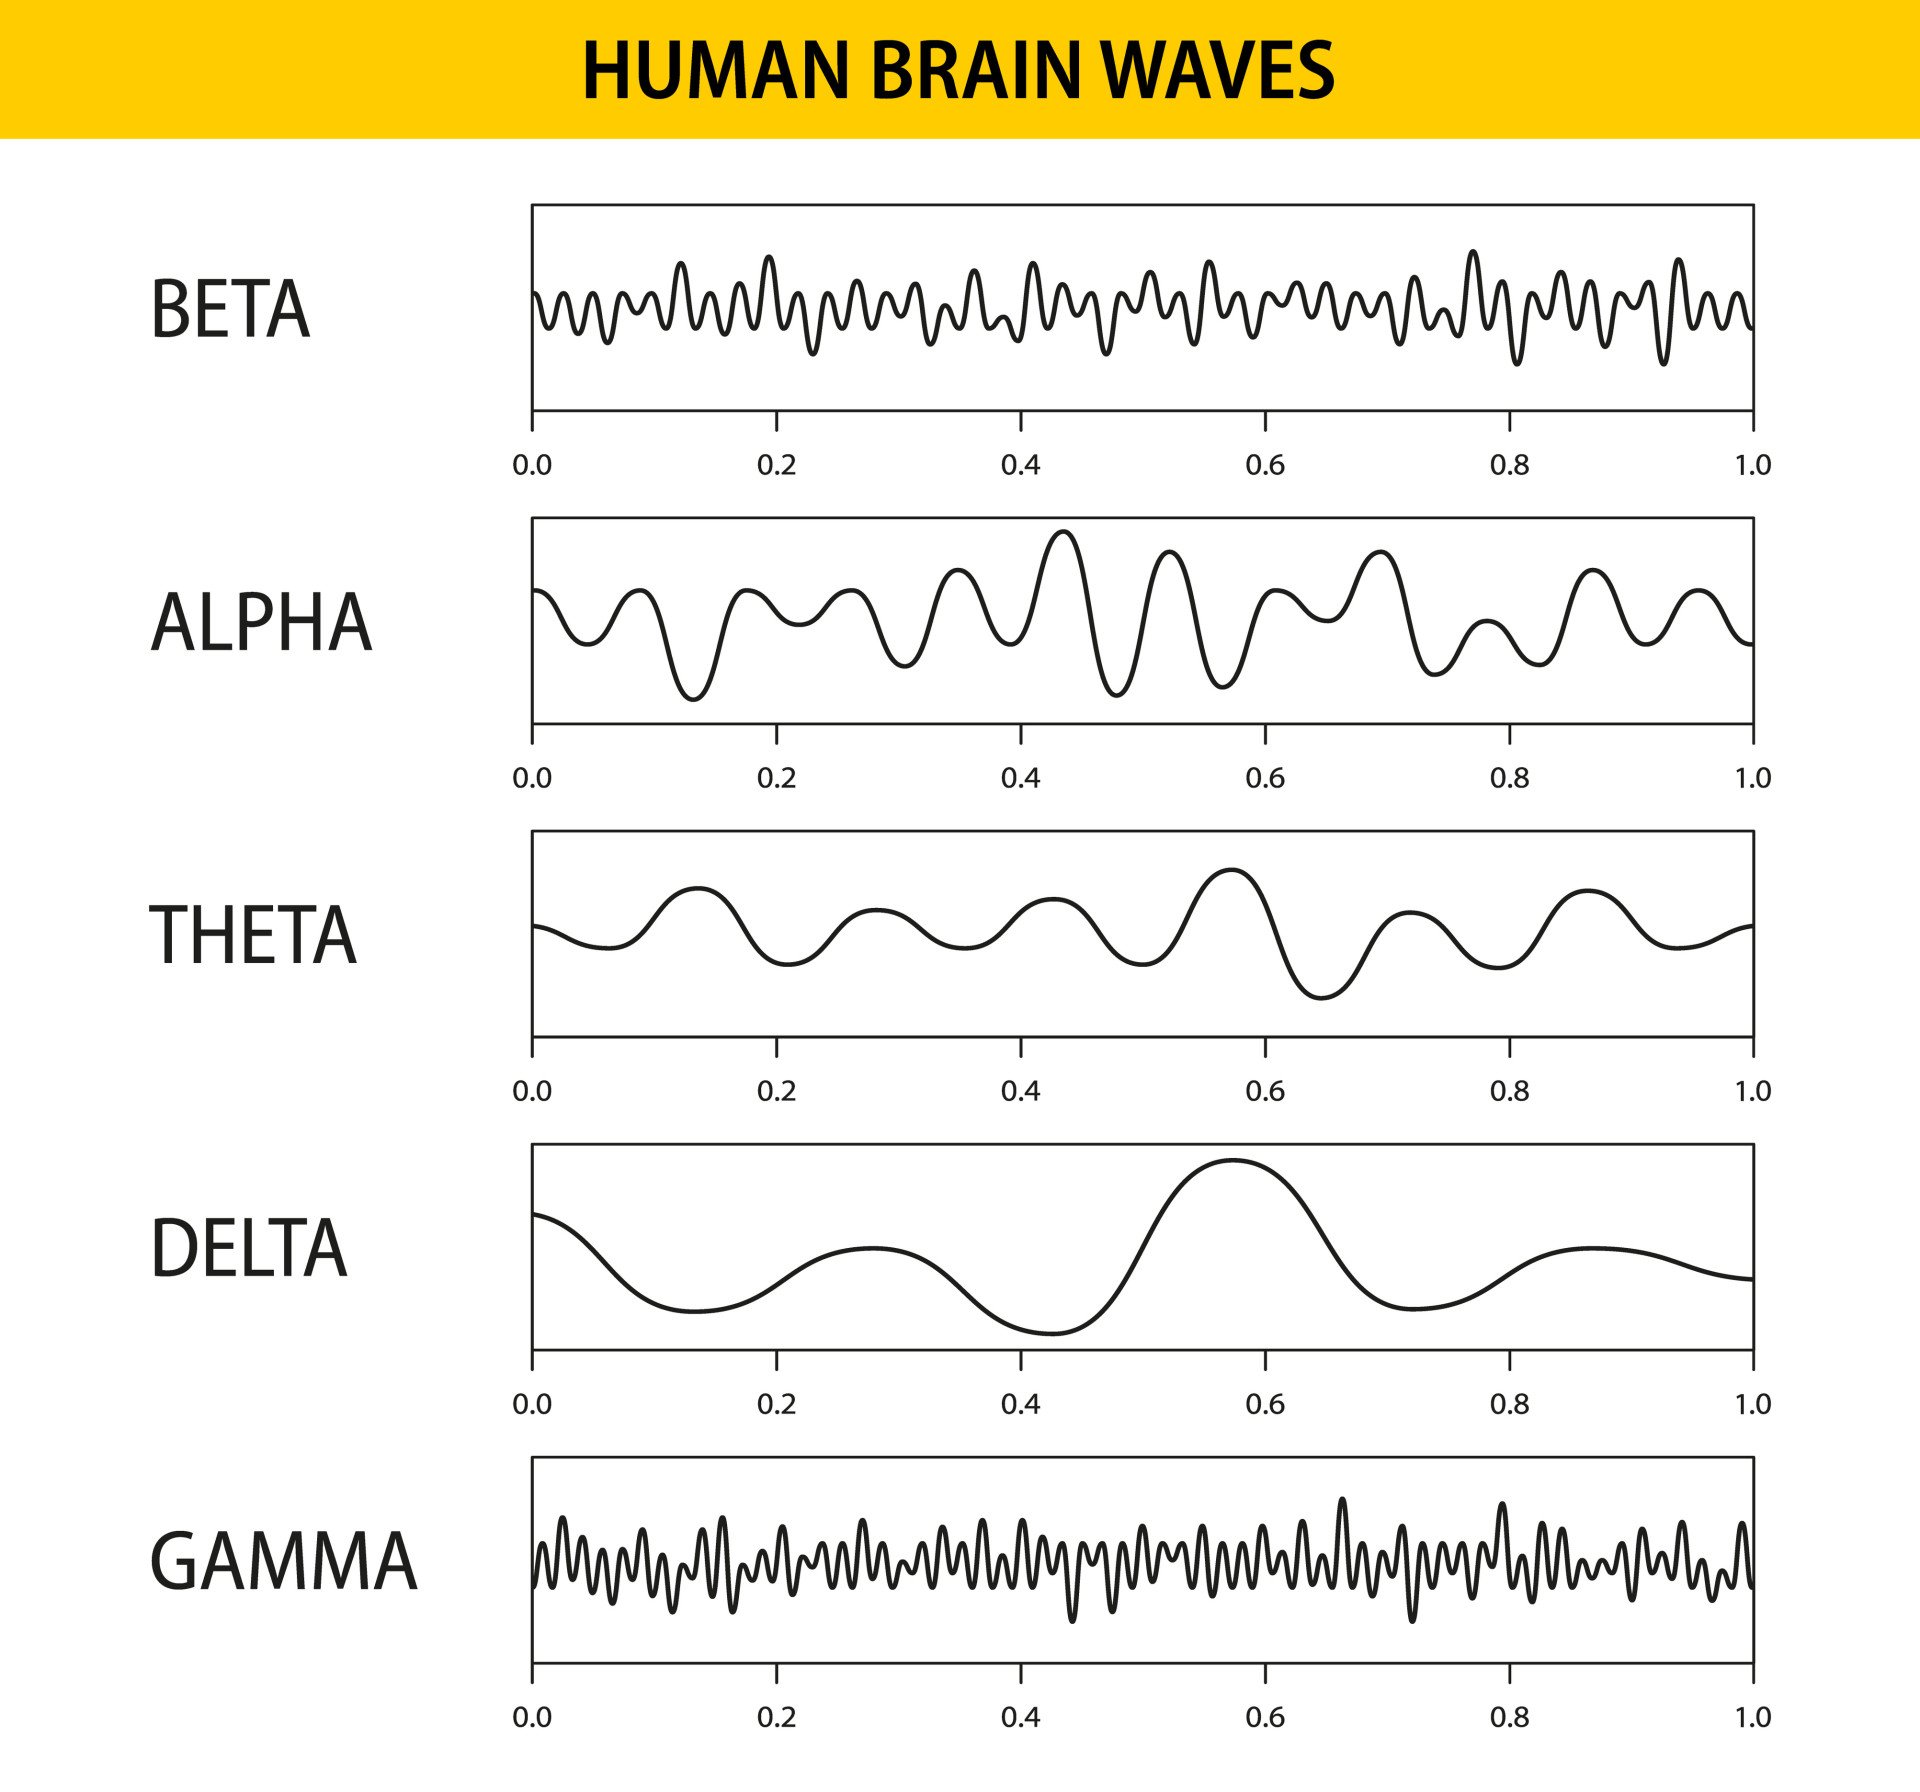
EEG recordings show brainwaves as wavy lines with rising and falling patterns.

Key Takeaways
- What It Is: An EEG records your brain’s electrical activity using painless electrodes placed on the scalp.
- Brainwaves: It measures five types (delta, theta, alpha, beta, and gamma) that help assess brain states such as sleep, alertness, and relaxation.
- Clinical Uses: EEGs help diagnose conditions like epilepsy, sleep disorders, and brain injuries, and are widely used in psychological and developmental research.
- Safety: The test is safe, non-invasive, and radiation-free, providing real-time data about your brain’s function.
- Limitations: EEGs track timing with great precision but cannot pinpoint exact brain locations, and can be affected by noise or movement.
What Does an EEG Do?
An EEG measures your brain’s electrical activity using small sensors called electrodes. These electrodes are placed on your scalp, where they detect tiny voltage fluctuations caused by the firing of neurons.
When neurons communicate, they do so by generating small electrical impulses known as action potentials.
A single neuron’s signal is too faint to detect. Large groups of neurons firing together create electrical fields strong enough for surface electrodes to pick up. Stronger synchrony produces a stronger signal.
Combined neuron signals form wave-like patterns called brainwaves, which the EEG machine amplifies and records.
The results appear as brainwaves—rhythmic patterns of activity that reflect different mental and physiological states.
Doctors and psychologists analyze these patterns to understand how your brain is functioning in real time.
Key Concepts:
- Electroencephalography: The technique of recording electrical activity from the brain.
- Electrode: A small metal disc placed on the scalp to detect brain activity.
- Action potential: An electrical signal used by neurons to transmit messages.
- Brainwave: A rhythmic pattern of neural activity shown on EEG.
What Does an EEG Measure?
EEG machines measure brainwaves, which vary based on your alertness, mood, and brain state. Each type of wave has a unique frequency, measured in hertz (Hz), the number of wave cycles per second.
Types of Brainwaves:
| Wave Type | Frequency Range | State Associated | Typical Location | Notes |
|---|---|---|---|---|
| Delta | 0.5–4 Hz | Deep sleep | Diffuse | Highest amplitude, slowest frequency |
| Theta | 4–8 Hz | Light sleep, drowsiness | Temporal | Seen in early sleep and meditation |
| Alpha | 8–13 Hz | Calm wakefulness | Occipital | Linked to relaxed, eyes-closed states |
| Beta | 13–30 Hz | Alert, focused | Frontal | Often seen during active thinking |
| Gamma | >30 Hz | Cognitive processing | Various | Less understood; linked to perception and memory |
Understanding these wave patterns helps clinicians assess everything from seizure activity to attention and sleep quality.
Event-Related Potentials (ERPs)
A single sensory or cognitive event is too small to see in the raw EEG, buried in the brain’s constant background activity. Researchers extract it using signal averaging: the same stimulus is presented dozens or hundreds of times, and the EEG is time-locked to each presentation.
Averaging many trials cancels out random background noise. The brain’s consistent response to the stimulus survives. What remains is the event-related potential (ERP): a small, reliable signal time-locked to the triggering event, revealing the brain’s response with millisecond precision.
Major ERP Components
ERP waveforms contain a sequence of positive and negative peaks, labelled by timing and polarity. Two early, sensory components appear first.
- P1 and N1 (visual): appear 80–200 ms after a visual stimulus and reflect early processing in the visual cortex.
- N1 (auditory): appears around 100 ms after a sound and reflects processing in the primary auditory cortex.
Later, cognitive components reveal how the brain interprets, not just detects, a stimulus.
- P300: a large positive wave 300–600 ms after a rare or meaningful stimulus, reflecting attention, working memory updating, and how the brain evaluates what it has just seen.
- N400: a negative wave around 400 ms that grows larger when a word does not fit its sentence, reflecting how the brain processes meaning in real time.
- Mismatch negativity (MMN): a negative response to an odd sound in a regular sequence, showing that the brain can detect change automatically, even without attention.
For example, the brain’s N400 response is larger for “cream and dog” than for “cream and sugar.”
Clinical and Research Uses
ERPs have real clinical value. The P300 and MMN can reveal cognitive processing in patients who cannot respond behaviourally, including those in a coma or vegetative state. Clinicians also use ERPs to track language difficulties after a stroke and attention problems in conditions such as ADHD.
The P300 is even used in lie-detection research and in assessing cognitive function after traumatic brain injury.
Development is another key use. ERPs are also valuable in research with infants and young children, who cannot describe what they perceive. Because identical stimuli can produce different ERPs depending on their meaning to the participant, the technique reveals mental interpretation, not just sensory detection.
Together, these advances have made ERPs one of the most widely used tools in cognitive neuroscience.
What Is an EEG Used For?
EEGs help diagnose and monitor many neurological and psychiatric conditions. They’re also used in research to understand brain function during different tasks and mental states.
Clinical Uses:
- Epilepsy: Detects abnormal spiking waves during or between seizures.
- Sleep disorders: Measures brain activity during different sleep stages.
- Brain injuries: Assesses functioning after trauma, stroke, or surgery.
- Dementia: Slowed waves can indicate neurodegeneration.
- Encephalitis: Can show diffuse brain inflammation.
- Tumors or stroke: May present as localized slowing or abnormal patterns.
Research Uses:
- Cognitive psychology: Tracks brain response to stimuli or tasks.
- Developmental studies: Used in infants to assess early brain function.
- Mental health: Some studies explore EEG patterns in conditions like ADHD or depression.
Example Studies:
- A study by Coutin-Churchman et al. (2003) found abnormal EEG activity in 83% of participants with mental health conditions. Decreases in delta and theta waves, often alongside increased beta activity, were common indicators of brain dysfunction.
- Bell (2012) used EEG to study working memory in 8-month-old infants. Increased frontal-parietal EEG coherence (how synchronised the activity is between two brain regions) was associated with better task performance, showing how EEG can track developmental differences in cognition.
A Brief History of EEG
German psychiatrist Hans Berger recorded the first human brain electrical activity on 6 July 1924. He placed electrodes on a 17-year-old patient’s scalp during neurosurgery.
Berger spent five more years checking his results before going public. In 1929, he published the paper that introduced the term electroencephalogram and described the alpha rhythm, now called the “Berger wave.”
Not everyone believed him at first. Many scientists suspected the signals came from muscle activity, not the brain. In 1934, British physiologists Edgar Adrian and Bryan Matthews confirmed his findings with improved equipment. The EEG was no longer dismissed as a curiosity.
By the 1930s, doctors were using the EEG to diagnose epilepsy. By the 1950s, it had helped researchers discover REM sleep.
EEG and Sleep Research
The EEG has shaped our understanding of sleep since the 1950s. By then, sleep researchers were using EEG recordings to track the stages of a full night’s sleep. One classic study, described below, provided the first objective evidence that dreaming is tied to a specific brain state.
Dement and Kleitman (1957): The Discovery of REM Sleep
- Aim: To test whether rapid eye movements (REM) during sleep are linked to dreaming, using objective measures instead of relying only on people’s memory of their dreams.
- Method: William Dement and Nathaniel Kleitman recorded EEG and eye-movement activity in nine sleeping participants. They woke each person during REM and non-REM sleep and asked what they had been dreaming.
- Results: Participants recalled a dream about 80% of the time when woken from REM sleep, compared with about 7% from non-REM sleep. REM periods recurred roughly every 90 minutes, and longer REM periods matched longer reported dreams.
- Conclusion: Dreaming occurs mainly during REM sleep, and the EEG-defined REM state gives researchers an objective marker for when dreaming happens.
The study’s small sample (detailed data from only five participants) limits how far we can generalise, and later research found that some dreaming also occurs outside REM sleep. Even so, it remains the foundation of modern sleep research.
EEG-Defined Sleep Stages
Building on Dement and Kleitman’s discovery, researchers later developed standard EEG criteria for staging sleep, now used in sleep labs worldwide.
- Stage 1: the transition from wakefulness; alpha waves give way to theta waves, and the sleeper is easily woken.
- Stage 2: light sleep, marked by brief bursts of fast activity called sleep spindles and large waves called K-complexes.
- Stages 3–4 (slow-wave sleep): deep sleep, dominated by slow delta waves and thought to be the most restorative stage.
- REM sleep: a paradox: the EEG looks almost like wakefulness, but the muscles are paralysed and the eyes move rapidly.
This cycle of light sleep, deep sleep, and REM repeats roughly every 90 minutes through the night, with REM periods growing longer as the night goes on. Sleep specialists still use this same EEG-based system today to diagnose conditions such as insomnia and sleep apnoea.
Step-by-Step EEG Procedure
The procedure is painless, safe, and usually takes 20–60 minutes (longer for sleep studies).
Before the Test:
- Wash your hair to remove oils and product.
- Avoid caffeine and alcohol.
- Follow sleep instructions if doing a sleep EEG.
During the Test:
- A technician measures your head and marks electrode positions.
- Electrodes are placed using paste or adhesive.
- You sit or lie still while the machine records brainwaves.
- You may be asked to close your eyes, breathe deeply, or respond to flashing lights.
- For some tests, you might be asked to sleep.
After the Test:
- Electrodes are removed, and your scalp is cleaned.
- If sedatives were used, you may need someone to drive you home.

Are There Any Risks to EEG?
EEGs are considered extremely safe. The electrodes do not emit electricity—they simply record signals. You won’t feel pain or discomfort during the test.
However, there are a few minor considerations:
- Seizure risk: In rare cases, a seizure may be triggered during testing in people with epilepsy—especially if flashing lights or hyperventilation are used as stimuli. This occurs under controlled, supervised conditions.
- Skin irritation: Some people experience mild irritation from the adhesive or paste used to attach the electrodes.
- Fatigue or drowsiness: Particularly if you were asked to sleep less the night before.
Compared to other neuroimaging techniques, EEG has fewer risks and is suitable even for young children and medically vulnerable individuals.

How Are EEG Results Interpreted?
The raw EEG data appears as wave patterns (like rolling hills) that reflect your brain’s ongoing activity. A neurologist interprets these patterns to look for abnormalities.
Normal Results:
- Clear alpha waves during relaxed wakefulness
- Appropriate delta and theta waves during sleep
Abnormal Results:
- Spikes or sharp waves: May indicate seizure activity
- Slowing: May suggest brain damage, stroke, or encephalopathy
- Burst suppression: A severe pattern often seen in coma
Keep in mind that some people show unusual EEG patterns even without any health condition. Results always need to be interpreted alongside symptoms and medical history.
What Are the Benefits and Limitations of an EEG?
Benefits:
- Non-invasive and safe: No radiation or electric current
- Real-time feedback: Excellent temporal resolution (millisecond-level)
- Cost-effective: Less expensive than MRI or PET
- Good for all ages: Especially useful with infants or people who can’t undergo scans
Limitations:
- Poor spatial resolution: Can’t precisely locate brain activity
- Susceptible to noise: Movement or muscle tension can interfere
- Surface activity only: Doesn’t measure deep brain regions
Contemporary Research
An earlier systematic review by Ismail and Karwowski (2020) mapped 143 studies using EEG to measure mental workload, fatigue, and stress. But it only counted how often a marker was used, not how reliable it actually was.
- Aim: Halkiopoulos et al. (2026) set out to find which EEG measures reliably track cognitive control, learning, emotion regulation, and mental health, and how useful they are clinically.
- Method: Following PRISMA guidelines, the team searched four major databases for studies published between 2015 and 2025. From 3,847 records, 210 studies covering almost 10,000 participants met their criteria for meta-analysis.
- Results: Frontal-midline theta reliably tracked cognitive control and learning, and a wave called the late positive potential indexed emotion regulation. Neurofeedback training on these markers produced large symptom drops for PTSD and moderate drops for anxiety, ADHD, and depression.
- Conclusion: EEG biomarkers show strong, consistent effects across cognitive and clinical domains, supporting their use in diagnosis and treatment-tracking. The authors stress that correlational evidence like this cannot yet prove cause and effect.
This meta-analysis carries more weight than the earlier narrative review (Ismail & Karwowski, 2020) because it pools effect sizes across the whole field rather than just counting studies.
A similar pattern holds in epilepsy.
A 2025 review of 60 studies found machine-learning EEG analysis could detect seizures with over 96% accuracy (Bai et al., 2025). The strongest evidence, in other words, keeps arriving where the data are largest and most standardised.
Comparison with Other Brain-Imaging Techniques
Choosing the EEG over fMRI, PET, MEG, or fNIRS is a trade-off between speed, spatial precision, cost, and invasiveness. No single technique wins on every dimension, and the right choice depends on the research question.
Functional MRI (fMRI)
Unlike the EEG, fMRI infers brain activity indirectly. It measures the blood-oxygen-level-dependent (BOLD) signal that follows the rise in local blood flow once neurons become active.
Because this blood-flow response takes several seconds to peak and fade, fMRI’s temporal resolution is limited to roughly one to two seconds. Its spatial resolution (1–3 mm) vastly exceeds the EEG’s (Logothetis, 2008).
The trade-off is real. In short: fMRI shows where; the EEG shows when, and neither method can resolve what the other sees best.
This makes the two techniques complementary rather than competing. The EEG also tolerates movement and works at the bedside or in a participant’s home, settings where fMRI’s loud, confining scanner is impractical.
The two methods are often combined, pairing the EEG’s timing with fMRI’s anatomical detail in a single study.
Positron Emission Tomography (PET)
PET works by injecting a radioactive tracer and detecting the radiation it releases in metabolically active tissue. This gives it a unique ability to image specific brain chemicals and neurotransmitter receptors that no electrical or magnetic method can reach (Raichle, 2009). That specificity comes at a cost.
PET is invasive, exposes participants to ionising radiation that limits how often they can be scanned, and rules out most paediatric and repeated-measures research.
It also requires an on-site cyclotron or tracer-delivery infrastructure costing millions of pounds, and offers a temporal resolution of many seconds to minutes. That is orders of magnitude slower than the EEG’s millisecond precision.
The EEG carries none of these risks.
This makes the EEG the realistic choice whenever a study involves children or needs frequent repeat scans.
Magnetoencephalography (MEG)
MEG detects the tiny magnetic fields produced by the same brain currents that generate the EEG signal, using sensors cooled to near absolute zero. Because magnetic fields pass through the skull largely undistorted, MEG suffers less from the blurring that limits the EEG’s spatial resolution (Baillet, 2017).
It is especially good at detecting signals from sources lying flat against the skull, a configuration the EEG picks up poorly.
But a MEG system can cost over a million pounds.
It also needs a magnetically shielded room and liquid helium to cool its sensors, and cannot be made portable. The EEG’s amplifiers, by contrast, fit in a bag and run almost anywhere.
MEG and the EEG are natural complements, not substitutes, since both share millisecond timing.
Functional Near-Infrared Spectroscopy (fNIRS)
Like fMRI, fNIRS shines near-infrared light through the scalp to measure blood oxygen, using lightweight, wearable sensors instead of a scanner (Ferrari & Quaresima, 2012). It shares fMRI’s core weakness: because it tracks a slow blood-flow response rather than electrical activity, its timing resolution is far behind the EEG’s.
It is, however, far more portable than an MRI scanner.
That also means fNIRS needs no bulky scanner. It is well suited to babies and toddlers too.
Speed and spatial precision trade off against each other in every current method. Because of this, researchers increasingly combine the EEG with fNIRS in a single wearable headset, recording electrical timing and blood-flow location together.
This growing EEG-fNIRS pairing is especially useful in brain-computer interface research, where portability matters as much as precision.
Is an EEG Right for You?
If your doctor suspects a seizure disorder, sleep problem, or cognitive change, an EEG may be recommended as part of your evaluation. It’s often one step in a broader neurological or psychological workup.
While it doesn’t give you a diagnosis on its own, it provides valuable information that helps doctors understand what’s happening in your brain.
References
Adrian, E. D., & Matthews, B. H. C. (1934). The Berger rhythm: Potential changes from the occipital lobes in man. Brain, 57(4), 355–385.
Bai, L., Litscher, G., & Li, X. (2025). Epileptic seizure detection using machine learning: A systematic review and meta-analysis. Brain Sciences, 15(6), 634. https://doi.org/10.3390/brainsci15060634
Baillet, S. (2017). Magnetoencephalography for brain electrophysiology and imaging. Nature Neuroscience, 20(3), 327–339. https://doi.org/10.1038/nn.4504
Bell, M. A. (2012). A psychobiological perspective on working memory performance at 8 months of age. Child Development, 83 (1), 251-265.
Berger, H. (1929). Über das Elektrenkephalogramm des Menschen. Archiv für Psychiatrie und Nervenkrankheiten, 87(1), 527–570.
Coutin-Churchman, P., Anez, Y., Uzcategui, M., Alvarez, L., Vergara, F., Mendez, L., & Fleitas, R. (2003). Quantitative spectral analysis of EEG in psychiatry revisited: drawing signs out of numbers in a clinical setting. Clinical Neurophysiology, 114 (12), 2294-2306.
Dement, W. C., & Kleitman, N. (1957). The relation of eye movements during sleep to dream activity: An objective method for the study of dreaming. Journal of Experimental Psychology, 53(5), 339–346.
Ferrari, M., & Quaresima, V. (2012). A brief review on the history of human functional near-infrared spectroscopy (fNIRS) development and fields of application. NeuroImage, 63(2), 921–935. https://doi.org/10.1016/j.neuroimage.2012.03.049
Halkiopoulos, C., Gkintoni, E., & Boutsinas, B. (2026). Mapping the digital mind: A meta-analysis of EEG biomarkers in cognition, emotion, and mental health. Brain Sciences, 16(4), 368. https://doi.org/10.3390/brainsci16040368
Ismail, L. E., & Karwowski, W. (2020). Applications of EEG indices for the quantification of human cognitive performance: A systematic review and bibliometric analysis. PLOS ONE, 15(12), e0242857. https://doi.org/10.1371/journal.pone.0242857
Logothetis, N. K. (2008). What we can do and what we cannot do with fMRI. Nature, 453(7197), 869–878. https://doi.org/10.1038/nature06976
Mayo Clinic. (April 15, 2020). EEG (Electroencephalogram) . https://www.mayoclinic.org/tests-procedures/eeg/about/pac-20393875
Raichle, M. E. (2009). A brief history of human brain mapping. Trends in Neurosciences, 32(2), 118–126. https://doi.org/10.1016/j.tins.2008.11.001