In psychology, a research paper outlines a study’s objectives, methods, results, discussion, and conclusions, ensuring clarity and adherence to APA (or relevant) formatting guidelines.
A typical research paper (lab report) would include the following sections: title, abstract, introduction, method, results, and discussion.
The title page, abstract, references, and appendices each start on a separate page. Subsections of the main body do not.
Use double-line spacing, a 12-point font, and page numbers. Your marking guide or the journal’s instructions set the finer details, such as margins and running heads.
Appendices hold material too bulky for the body but needed to check or repeat the study, such as full questionnaires, stimulus lists, and consent forms. Refer to them in the text.
The report should have a thread of arguments linking the prediction in the introduction to the content of the discussion.
Why Reports Have a Fixed Structure
Readers use a report in three ways. Some read it from start to finish. Others skim the abstract and drop into the results. A third group looks up one fact, such as the sample size.
A fixed order serves all three readers. Each piece of information always sits in the same place. It also forces the writer to keep apart what was predicted, what was done, what was found, and what it means.
The standard order is often abbreviated IMRaD, after its four central sections: introduction, method, results and discussion.
A fixed format also supports replication, which means repeating a study to check that its finding holds. Other researchers use the method to rerun a study. A report that leaves out key procedural details makes its claim impossible to check.
The Hourglass Shape
Bem (2003) describes a whole paper as an hourglass.
The introduction starts with broad statements and narrows step by step to the specific question. The method and results form the narrow neck. The discussion then widens again, from the findings to their implications and to the broadest points the author is entitled to make.
The discussion is often a near mirror image of the introduction. The introduction’s funnel is the top half of the hourglass.
Bem also advises leading readers step by step towards the formal statement of the problem, and using examples to make abstract points concrete. Where possible, open with a statement about people rather than about psychologists or their research. Plan your own outline to test the logic of the sequence.
What Each Section Must Answer
Each section answers one question and depends on the one before it.
| Section | The question it answers | What it must connect to |
|---|---|---|
| Title | What is this study about? | The variables and topic named in the introduction |
| Abstract | What was done and found, in brief? | Every other section (it is written last) |
| Introduction | Why was this study needed, and what was predicted? | Ends in the aim and hypothesis |
| Method | What exactly was done, to whom, with what? | Tests the hypothesis; gives enough detail to repeat the study |
| Results | What was found? | The data that bear on the hypothesis, no more and no less |
| Discussion | What do the findings mean? | Returns to the hypothesis and the studies in the introduction |
| References | Where does each cited claim come from? | Every name and date in the text |
Test the Thread Before You Submit
Try a simple test. Read three paragraphs in a row: the end of your introduction, the start of your results, and the start of your discussion. The hypothesis should reappear in matching terms in each.
Suppose your introduction predicts that one group will recall more words than another. The results should then compare recall between those groups.
The discussion should open by saying whether the prediction held. Two signs suggest a broken thread. One is a variable that appears in the method but never in the results. The other is a result the discussion treats as central that the introduction never anticipated.
The thread also decides what goes in the introduction. Previous studies belong there because they lead to the hypothesis, not because they exist.
Title Page
This must indicate what the study is about. It must include the variables under investigation. It should not be written as a question.
Make the title informative. It should make sense on its own and use the words a searcher would type, because databases index titles. Bem (2003) suggests roughly ten to twelve words, and recommends writing the title last, once the most instructive finding is clear.
Your department or journal decides what else the title page carries, such as author, affiliation, course, and date.
Title pages should be formatted in APA style.
Abstract
The abstract provides a concise and comprehensive summary of a research report. Your style should be brief but not use note form. Look at examples in journal articles.
A typical student abstract runs to about 150 words, although journals and departments set their own limits (APA-style abstracts are often allowed up to 250). It should explain the following very briefly:
- Aim and rationale: Start with one or two sentences giving the aim and rationale for the study.
- Participants and setting: Describe who, when, where, how many, and what groups.
- Design and measures: Describe the design, the experimental treatment, and the questionnaires, surveys, or tests used.
- Main findings: Describe the major findings, including the statistics used and the significance levels, or simply one sentence summing up the outcome.
- Contribution: Finish with the study’s “contribution to knowledge” within the literature. What does it all mean? Mention the implications of your findings if appropriate.
Advice
The abstract comes first in your report but is written last. It summarises every other section.
Introduction
The introduction explains where your hypothesis comes from. A hypothesis is a testable prediction about your results, so the introduction must give a rationale (a reason) for your study.
Ideally, the introduction should have a funnel structure: Start broad and then become more specific. The aims should not appear out of thin air; the preceding review of psychological literature should lead logically into the aims and hypotheses.
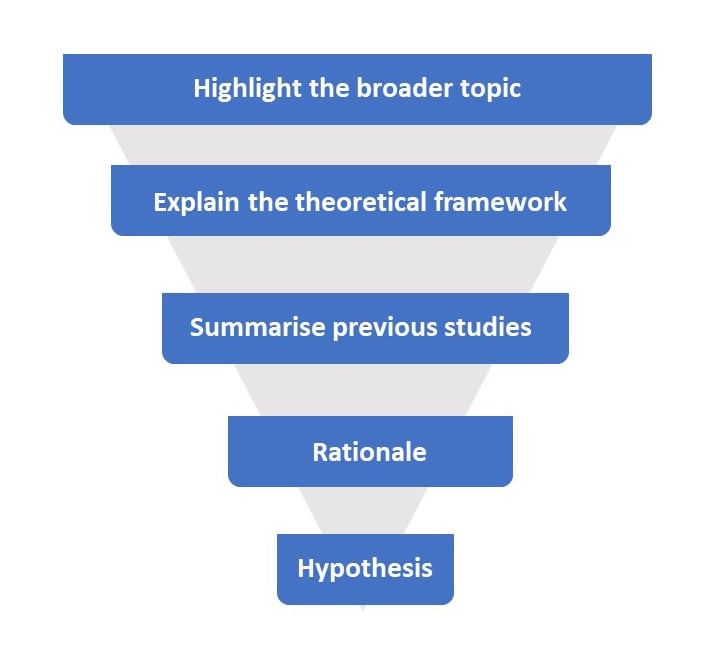
- General theory: Start broad, briefly introducing the topic. Define the important key terms.
- Theoretical framework: Explain the theory or model that generates your prediction.
- Previous studies: Synthesize the studies that lead to your hypothesis. What was the purpose? Who took part? What was found? How does it relate to the theory?
- Rationale: How does your study address a gap in the literature? Perhaps it overcomes a limitation (a weakness that restricts what earlier work can show).
- Aims and hypothesis: Explain what you plan to investigate and make a clear, concise prediction about the results you expect.
Advice
There should be a logical progression of ideas that aids the flow of the report. This means the studies outlined should lead logically to your aims and hypotheses.
Do be concise and selective, and avoid the temptation to include anything in case it is relevant (i.e., don’t write a shopping list of studies).
Group studies by what they show, not by author. End each group by saying how it leads to the gap your study fills.
State the hypothesis precisely enough that the results could show it to be wrong. Name the variables, the expected direction, and the population. Justify a directional prediction from the literature.
Use the same label for each variable in the method, results, and discussion. Changing labels midway confuses readers.
Method
The method says exactly what was done. Use these four subheadings: participants, design, materials, and procedure.
Participants
- How many participants were recruited?
- Say how you obtained your sample (e.g., opportunity sample).
- Give relevant demographic details (e.g., gender, ethnicity, age range, mean age, and standard deviation).
- If anyone was excluded, say how many and why, and whether exclusions were even across conditions, because uneven exclusion can produce a difference on its own (Bem, 2003).
- Say how participants were allocated to conditions.
- Say how you decided on the sample size, for example by power analysis, a calculation of the sample needed to detect a given effect size (Lakens, 2022).
Design
- State the experimental design.
- What were the independent and dependent variables? Make sure the independent variable is labeled and name the different conditions/levels.
- For example, if gender is the independent variable label, then male and female are the levels/conditions/groups.
- How were the IV and DV operationalized?
- Identify any controls used, e.g., counterbalancing (varying the order of conditions across participants so order effects do not distort the results) and control of extraneous variables.
- Use random allocation in an independent-groups design, and give everyone standardised instructions.
- Name conditions with easily remembered, operational labels (a $1 group and a $20 group, not “Treatment 3”; Bem, 2003).
Materials
- List all the materials and measures (e.g., what was the title of the questionnaire? Was it adapted from a study?).
- You do not need to reproduce the materials in full. Include a “sensible” level of detail instead, for example sample questionnaire items.
- Include the reliability of each measure (e.g., internal-consistency alpha values), whether from the test manual or from your own sample.
- Describe any stimuli, scale labels, and scoring so the reader can picture the participant’s experience (Bem, 2003).
Procedure
- Describe the precise procedure you followed when conducting your research, i.e., exactly what you did.
- Describe it in enough detail to allow replication: another researcher could repeat your study and check whether the finding holds.
- Be concise and omit extraneous or trivial details. Instructions, debriefing, and record sheets are often summarised or left out of short student reports.
- Check your marking guide, though. Some markers and journals expect a statement on consent and debriefing, and an ethics note if participants were deceived or exposed to discomfort (see research ethics).
- Mention what went wrong only if it could affect interpretation, such as participants dropping out of a high-stress condition (Bem, 2003).
Advice
- Assume the reader knows nothing about your study. They should be able to replicate (i.e., copy) it exactly from what you write here.
- Write in the past tense.
- Don’t justify or explain in the Method (e.g., why you chose a particular sampling method); just report what you did.
Results
- Order: Present descriptive statistics first, then inferential statistics.
- Descriptives: Report the means, standard deviations, and 95% confidence intervals (CIs) for each IV level. Use an APA-style table for four to 20 numbers.
- The test: Name the statistical test being used.
- Test statistic: Report the statistic, its degrees of freedom, and the p value (e.g., a t-score).
- Direction and size: Say whether the result was significant and which group performed better. Then report the size of the difference.
- Effect size: Report an effect size (such as Cohen’s d) and its confidence interval unless your marking guide says otherwise (Lakens, 2013; Cumming, 2014).
Advice
- Avoid interpreting the results (save this for the discussion).
- Make sure the results are presented clearly and concisely. A table can be used to display descriptive statistics if this makes the data easier to understand.
- Do not include raw data.
- Follow APA style.
Preliminary Checks and Exploratory Analyses
Before the main test, briefly report any checks the analysis relies on. Bem (2003) suggests showing that the study set up the conditions it needed, for example with a manipulation check, or that groups did not differ on an unintended variable. Keep these checks short.
Make clear which analyses you planned and which you did not. Fine-tuning an analysis after seeing the data undermines the interpretation of standard tests. So plan ahead.
Wagenmakers et al. (2012) therefore propose calling only analyses specified in advance confirmatory, and labelling everything else exploratory. The APA’s reporting standards now sort hypotheses, analyses, and conclusions into primary, secondary, and exploratory groups (Appelbaum et al., 2018).
For a student report, the rule is simple. Report the analysis you planned. If you ran others, say so and label them exploratory. Exploratory results can suggest ideas, but chance can produce spurious findings, so present them tentatively (Bem, 2003).
APA Style for Reporting Statistics
- Decimals: Report most numbers to two decimal places, with a zero before the decimal point (e.g., 0.51).
- Values up to 1: Report numbers that can never exceed 1 (such as p values and correlations) to three decimal places, with no leading zero (e.g., .016).
- Exact p values: Report exact p values, using p < .001 for very small values.
- Whole numbers: Report percentages and degrees of freedom as whole numbers.
- Symbols: Italicise statistical symbols that are not Greek letters (e.g., M, SD, t, F, p, d).
- Spacing: Include spaces on either side of the equals sign.
- Confidence intervals: Give the upper and lower limits inside square brackets, e.g., “95% CI [73.37, 102.23]”.
Worked Results Examples
Introduce each main result by reminding the reader of the question, then state the answer in words, then give the numbers that support it. Explain why it happened in the discussion, not here (Bem, 2003).
The example below is invented to show the form. It is not a real study.
Sixty participants (30 per group) studied 20 words in silence or with background music, then recalled as many as they could. An independent-samples t test compared the groups.
| Condition | n | M | SD | 95% CI for the mean |
|---|---|---|---|---|
| Silence | 30 | 13.20 | 1.56 | [12.62, 13.78] |
| Background music | 30 | 12.13 | 1.78 | [11.47, 12.80] |
Participants in the silence condition recalled more words (M = 13.20, SD = 1.56) than participants in the music condition (M = 12.13, SD = 1.78). The mean difference was 1.07 words, 95% CI [0.20, 1.93], t(58) = 2.47, p = .016, d = 0.64.
The numbers connect. Degrees of freedom are 58 (two groups of 30, minus 2). The pooled standard deviation is 1.67, and the standard error of the difference is 0.43. So t is 1.07 divided by 0.43, which gives 2.47.
Cohen’s d is the mean difference divided by the pooled standard deviation (1.07 / 1.67 = 0.64). That is a medium-sized effect by Cohen’s rough benchmarks.
The confidence interval for the difference excludes zero, which agrees with the significant p value. It is also wide. The data fit anything from a very small to a fairly large cost of music, so a good discussion would use that width, not just the p value.
The figures come from the unrounded scores, so recalculating from the rounded table values can differ in the second decimal place.
Checking Your Own Results
A reported test statistic, its degrees of freedom, and its p value are linked by arithmetic. You can check any one from the other two.
For example, t(28) = 2.10, p = .045 is consistent. But t(38) = 1.90, p < .05 is not. The two-tailed p value for that statistic is .065, so the result claims significance the statistic does not support.
The check matters. Nuijten et al. (2016) used a program called statcheck to recompute p values from 258,105 APA-style test results in 30,717 articles from eight psychology journals.
Almost half of the articles with such results (49.6%) contained at least one inconsistent p value. Across all results, 9.7% of p values were inconsistent. Only 1.4% were grossly inconsistent, meaning the mismatch changed the significance conclusion.
The errors that mattered tended to favour significance.
Discussion
- Main finding: Outline your findings in plain English (avoid statistical jargon) and relate your results to your hypothesis, e.g., is it supported or rejected?
- Link to the introduction: Compare your results to the background studies in the introduction. Are they similar or different? Discuss why or why not.
- Limitations: Acknowledge only limitations that could explain the result, such as a confounding variable that might account for it instead of the IV. Name the feature and the alternative explanation it allows.
- Improvements: Suggest constructive ways to improve your study if appropriate.
- Implications: What do your findings mean for how people behave in the real world?
- Further research: Suggest an idea triggered by your study, in the same area but not simply an improved version of it. A limitation of your study can inspire it.
- Conclusion: Finish with a statement of your findings and the key points of the discussion (interpretation and implications) in no more than 3 or 4 sentences.
Limitations, Unexpected Results and Post Hoc Ideas
The advice to mention limitations only when they could explain the result protects you from a ritual paragraph about small samples.
It is not a licence to hide awkward features.
Bem (2003) advises reminding readers of sample or method features that limit generalisation, without dwelling on every flaw. A limitation worth reporting names a feature of the study and the alternative explanation it allows. Report it even when the result is significant.
Accept an unexpected or null result. Do not build an elaborate account to explain it away.
Bem (2003) warns against long theories built to cover every irregularity, and reminds authors that an article is not a chronology of their thinking.
A non-significant result means the study did not detect a difference. That is not the same as showing there is none. Say what limited the study’s ability to detect one, such as the sample size, the measure, or the size of the manipulation.
Ideas that arise after you see the data can go in the discussion, labelled as post hoc.
Hollenbeck and Wright (2017) propose a clearly labelled subsection for post hoc exploratory analyses.
What to avoid is HARKing. That means hypothesising after the results are known, and presenting a post hoc idea as if it had been predicted (Kerr, 1998). Do not rewrite your introduction so that a post hoc idea looks like a prediction.
Reference Page
The reference section lists all the sources cited in the report, in alphabetical order by the first author’s surname. It is not a bibliography (a list of everything you read). Every entry must also be cited in the text.
In simple terms, every time you refer to a psychologist’s name (and date), you need to reference the original source of information.
Cite the original source of each finding, not the textbook or website that mentions it. That means reading the original paper, or at least its abstract.
A textbook’s reference list makes the entry easy to find. But do not simply copy a citation from it. Websites often give no reference section at all, so search for the original paper instead.
References need to be set out APA style:
Books
Author, A. A. (Year). Title of work (edition, if not the first). Publisher.
APA 7th edition no longer includes the publisher’s location. For a chapter in an edited book, give the chapter title first, then the editors, the book title in italics, and the page range.
Author, A. A. (Year). Title of chapter. In E. E. Editor (Ed.), Title of book (pp. xx–xx). Publisher.
Journal Articles
Author, A. A., Author, B. B., & Author, C. C. (Year). Article title. Journal Title, Volume(Issue), page numbers. https://doi.org/xxxxx
Add the DOI (digital object identifier) as a link whenever the article has one. Here is an example:
Nuijten, M. B., Hartgerink, C. H. J., van Assen, M. A. L. M., Epskamp, S., & Wicherts, J. M. (2016). The prevalence of statistical reporting errors in psychology (1985–2013). Behavior Research Methods, 48(4), 1205–1226. https://doi.org/10.3758/s13428-015-0664-2
A simple way to write your reference section is to use Google scholar. Just type the name and date of the psychologist in the search box and click on the “cite” link.
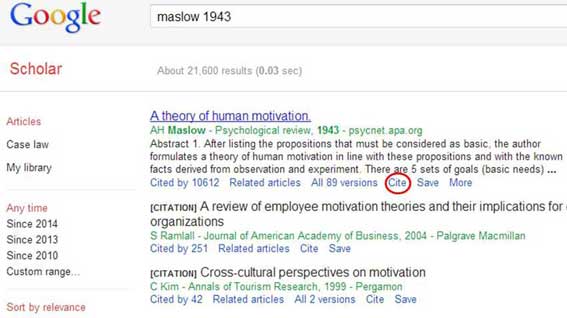
Next, copy and paste the APA reference into the reference section of your report. Then check it against the source. Automatically generated references often need correcting.
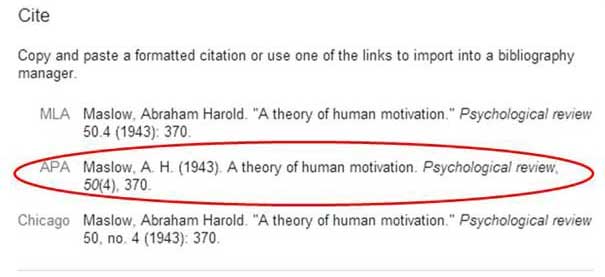
Once again, remember that references need to be in alphabetical order according to surname.
Writing the Report: Process, Style and Common Mistakes
Treat the write-up as something that builds up over the project, not a mountain to climb at the end. Plan the report, and draft the introduction and method, while you are still collecting data.
Keep the report a simple story. Stick to the main themes and the one or two questions that guided the investigation.
Then step back and read it as an informed outsider would. Feedback from colleagues also helps.
Write Plainly
Clarity is part of accuracy. Bem (2003) argues that scientific writing should be accurate and clear, aimed at a bright non-specialist, and edited sentence by sentence for needless words. His summary is a short slogan: “Good writing is good teaching.”
Needless complexity can backfire. In five experiments, Oppenheimer (2006) found that texts made more complex were judged to come from less intelligent authors. The effect was mediated by how hard the text was to read.
That does not mean specialist terms are never needed. It is a warning that needless difficulty reads as weaker thinking.
Scientific writing has also been getting harder to read. Plavén-Sigray et al. (2017) applied two readability formulas to 709,577 abstracts from 123 journals published between 1881 and 2015.
Readability fell steadily, partly because of a rise in general scientific jargon. The journals were mostly biomedical, so the trend may not hold exactly for psychology.
Common Mistakes
Watch for these frequent slips:
- Hypothesis mismatch: The prediction names one variable but the results analyse another. Write the hypothesis in the same terms as the design.
- Shopping-list introduction: Studies are listed with no thread. Group them by what they show, and end each paragraph on how it leads to the gap.
- Justifying in the method: The method explains why a sampling method was chosen. Move the justification to the introduction or discussion.
- Wrong level of detail: Participant numbers or exact measures are missing, or the story of which room was booked is included.
- Interpreting in the results: The results explain why, or give statistics with no statement of what they show.
- Formatting errors: Degrees of freedom are missing, p values are given as thresholds only, symbols are not italicised, or numbers do not match.
- Ritual limitations: A generic list (small sample, student participants) never says whether any limitation could explain the result.
- Restated results: Each discussion sentence should add something: a link to earlier work, an implication, or a next step.
- Citation mismatches: Names in the text have no entry in the references, or entries are never cited.
- Abstract written first: Write it last.
Reporting Standards and Open Practices
The IMRaD order says where information goes, not which information must appear. Reporting standards specify the contents. The APA’s standards for quantitative research recommend what to include in each part of a paper (Appelbaum et al., 2018). Parallel standards cover qualitative and mixed-methods work (Levitt et al., 2018).
Open practices go further. Authors deposit materials, data, and analysis scripts in an independent repository and say so in the report. Practice lags behind this ideal.
Hardwicke et al. (2020) manually coded a random sample of 250 social science articles published from 2014 to 2017. Materials were available in 11% of the articles where this applied, and raw data in 7%. None of the studies was preregistered.
Incentives can help. Kidwell et al. (2016) compared articles in five psychology journals, one of which began awarding badges for open data and open materials in 2014.
In that journal, reported open data rose from under 3% of articles to 39% in the first half of 2015. The comparison journals did not change. Badges were not randomly assigned, so the causal claim is cautious.
Psychology Lab Report Example
Quantitative paper template
Study this six-page article. Bago et al. (2020) set out to decide between two accounts of belief in political misinformation.
One says deliberation causes people to fall for fake news. It helps them rationalise headlines that fit their politics. The other says people judge headlines poorly when they rely on intuition.
In the method, 1,635 Mechanical Turk workers saw a series of headlines. For each, they first answered quickly under time pressure and a memory load. Then they had an unconstrained chance to rethink.
Participants believed false headlines, but not true ones, more in their first responses than in their final ones.
Political polarisation did not differ. Deliberation corrected intuitive mistakes without increasing partisan bias.
Notice how the question, the two rival predictions, the manipulations, and the pattern of results line up exactly. That is the thread of argument described earlier. The sample is an online convenience sample, so the result describes these participants and this task, not people in general.
Quantitative professional paper template: Adapted from “Fake News, Fast and Slow: Deliberation Reduces Belief in False (but Not True) News Headlines,” by B. Bago, D. G. Rand, and G. Pennycook, 2020, Journal of Experimental Psychology: General, 149(8), pp. 1608–1613 (https://doi.org/10.1037/xge0000729). Copyright 2020 by the American Psychological Association.
Qualitative paper template
A qualitative report keeps the same overall logic (why, how, what, so what). The sections do different work, because the analysis is inductive: themes are built from the data instead of testing a prediction.
- Introduction section: The review still leads to a rationale, but the aim is usually a research question, not a testable prediction.
- Method section: Disclose the approach (such as grounded theory or thematic analysis), sampling, data collection, analysis, ethics, and reflexivity (the researchers’ own position and assumptions).
- Results section: Present themes or categories, each with a label, a prose account, and short quotations from participants, instead of tables of statistics.
- Discussion section: Claim the depth and plausibility of the account and its transferability to other settings, not statistical generalisation.
Reporting standards exist for qualitative work too. The APA standards cover qualitative, qualitative meta-analytic, and mixed-methods research (Levitt et al., 2018).
Tong et al. (2007) pooled items from 22 earlier checklists into a 32-item checklist for interviews and focus groups.
The template below is Harkin and Kuss (2021). They ran focus groups with 21 participants and analysed the data with constructivist grounded theory. Participants described their phones as an extension of themselves.
The findings are an account of these 21 people, not an estimate for smartphone users in general. Notice how the method does the heavy lifting on sampling and analysis. The results are the category structure.
DownloadQualitative professional paper template: Adapted from “‘My Smartphone Is an Extension of Myself’: A Holistic Qualitative Exploration of the Impact of Using a Smartphone,” by L. J. Harkin and D. Kuss, 2021, Psychology of Popular Media, 10(1), pp. 28–38 (https://doi.org/10.1037/ppm0000278). Copyright 2020 by the American Psychological Association.
Key Takeaways
- IMRaD Order: A report runs title, abstract, introduction, method, results, and discussion, then references. Each section answers a different question.
- One Argument: The hypothesis at the end of the introduction is what the results test and the discussion answers.
- Replicable Method: Write it so a reader could repeat the study from it alone, using participants, design, materials, and procedure.
- Results Reporting: Report descriptive then inferential statistics in APA format, with an effect size. Leave interpretation for the discussion.
- Discussion: Say whether the hypothesis was supported, relate it to earlier research, and name only limitations that could explain the result.
- References: Cite original sources, list them alphabetically, and check every entry against the source.
- Honest Reporting: Published numbers are often inconsistent and materials rarely shared, so recompute your p values and label exploratory analyses.
References
Appelbaum, M., Cooper, H., Kline, R. B., Mayo-Wilson, E., Nezu, A. M., & Rao, S. M. (2018). Journal article reporting standards for quantitative research in psychology: The APA Publications and Communications Board task force report. American Psychologist, 73(1), 3–25. https://doi.org/10.1037/amp0000191
Bago, B., Rand, D. G., & Pennycook, G. (2020). Fake news, fast and slow: Deliberation reduces belief in false (but not true) news headlines. Journal of Experimental Psychology: General, 149(8), 1608–1613. https://doi.org/10.1037/xge0000729
Bem, D. J. (2003). Writing the empirical journal article. In J. M. Darley, M. P. Zanna, & H. L. Roediger III (Eds.), The compleat academic: A practical guide for the beginning social scientist (2nd ed.). American Psychological Association.
Cumming, G. (2014). The new statistics: Why and how. Psychological Science, 25(1), 7–29. https://doi.org/10.1177/0956797613504966
Hardwicke, T. E., Wallach, J. D., Kidwell, M. C., Bendixen, T., Crüwell, S., & Ioannidis, J. P. A. (2020). An empirical assessment of transparency and reproducibility-related research practices in the social sciences (2014–2017). Royal Society Open Science, 7(2), Article 190806. https://doi.org/10.1098/rsos.190806
Harkin, L. J., & Kuss, D. (2021). “My smartphone is an extension of myself”: A holistic qualitative exploration of the impact of using a smartphone. Psychology of Popular Media, 10(1), 28–38. https://doi.org/10.1037/ppm0000278
Hollenbeck, J. R., & Wright, P. M. (2017). Harking, sharking, and tharking: Making the case for post hoc analysis of scientific data. Journal of Management, 43(1), 5–18. https://doi.org/10.1177/0149206316679487
Kerr, N. L. (1998). HARKing: Hypothesizing after the results are known. Personality and Social Psychology Review, 2(3), 196–217. https://doi.org/10.1207/s15327957pspr0203_4
Kidwell, M. C., Lazarević, L. B., Baranski, E., Hardwicke, T. E., Piechowski, S., Falkenberg, L.-S., Kennett, C., Slowik, A., Sonnleitner, C., Hess-Holden, C., Errington, T. M., Fiedler, S., & Nosek, B. A. (2016). Badges to acknowledge open practices: A simple, low-cost, effective method for increasing transparency. PLOS Biology, 14(5), Article e1002456. https://doi.org/10.1371/journal.pbio.1002456
Lakens, D. (2013). Calculating and reporting effect sizes to facilitate cumulative science: A practical primer for t-tests and ANOVAs. Frontiers in Psychology, 4, Article 863. https://doi.org/10.3389/fpsyg.2013.00863
Lakens, D. (2022). Sample size justification. Collabra: Psychology, 8(1), Article 33267. https://doi.org/10.1525/collabra.33267
Levitt, H. M., Bamberg, M., Creswell, J. W., Frost, D. M., Josselson, R., & Suárez-Orozco, C. (2018). Journal article reporting standards for qualitative primary, qualitative meta-analytic, and mixed methods research in psychology: The APA Publications and Communications Board task force report. American Psychologist, 73(1), 26–46. https://doi.org/10.1037/amp0000151
Nuijten, M. B., Hartgerink, C. H. J., van Assen, M. A. L. M., Epskamp, S., & Wicherts, J. M. (2016). The prevalence of statistical reporting errors in psychology (1985–2013). Behavior Research Methods, 48(4), 1205–1226. https://doi.org/10.3758/s13428-015-0664-2
Oppenheimer, D. M. (2006). Consequences of erudite vernacular utilized irrespective of necessity: Problems with using long words needlessly. Applied Cognitive Psychology, 20(2), 139–156. https://doi.org/10.1002/acp.1178
Plavén-Sigray, P., Matheson, G. J., Schiffler, B. C., & Thompson, W. H. (2017). The readability of scientific texts is decreasing over time. eLife, 6, Article e27725. https://doi.org/10.7554/eLife.27725
Tong, A., Sainsbury, P., & Craig, J. (2007). Consolidated criteria for reporting qualitative research (COREQ): A 32-item checklist for interviews and focus groups. International Journal for Quality in Health Care, 19(6), 349–357. https://doi.org/10.1093/intqhc/mzm042
Wagenmakers, E.-J., Wetzels, R., Borsboom, D., van der Maas, H. L. J., & Kievit, R. A. (2012). An agenda for purely confirmatory research. Perspectives on Psychological Science, 7(6), 632–638. https://doi.org/10.1177/1745691612463078