Research methods are the ways psychologists plan, carry out and check their studies. Data handling is the skill of working with the numbers and graphs a study produces. In AQA GCSE Psychology (8182) both are Section D of Paper 1, worth 25 of the 100 marks, and their questions also appear in every topic on both papers.
Key Takeaways
Formulation of Testable Hypotheses
- A hypothesis is a testable prediction. The null hypothesis predicts no difference between conditions (the different versions people experience). The alternative hypothesis predicts a difference.
Types of Variable
- The independent variable is what the researcher changes. The dependent variable is what they measure. Extraneous variables are other things that could change the results.
Sampling Methods
- The target population is the whole group a study is about. The sample is the smaller group who take part. A fair sample lets the findings apply to everyone.
- Random sampling gives everyone an equal chance. Opportunity sampling uses whoever is available. Systematic sampling takes every nth person, such as every tenth. Stratified sampling picks randomly from each subgroup.
Designing Research
- Independent groups uses different people in each condition. Repeated measures uses the same people in every condition. Matched pairs uses different people paired on something that matters.
- A laboratory experiment is controlled but artificial. A field experiment is in an everyday setting. In a natural experiment, the independent variable changes by itself.
- Interviews and questionnaires ask people questions, but people may not answer truthfully. A case study looks in depth at one unique case. An observation records behaviour in set categories.
Correlation
- A correlation is a link between two co-variables (the two things measured), shown on a scatter diagram. It cannot show cause and effect, as a third factor may explain it.
Research Procedures
- A standardised procedure gives everyone the same instructions and conditions. Counterbalancing means half do condition A then B, and half do B then A.
- Randomisation uses chance to set the order of items. Random allocation uses chance to place people in conditions.
Planning and Conducting Research
- Reliability means you would get similar results if you repeated the study, and interobserver reliability means two observers’ records match. Validity means the study measures what it claims to.
Ethical Considerations
- The British Psychological Society (BPS) guidelines cover consent, deception, the right to withdraw, harm, confidentiality and debriefing (a full explanation at the end).
- Each ethical issue needs a matching way of dealing with it, such as asking parents to sign a consent form.
Data Handling
- Quantitative data are numbers, and qualitative data are descriptions. Any method can give either. Primary data are collected first-hand, and secondary data were collected earlier by someone else.
- The mean is the total divided by how many scores. The median is the middle score, the mode is the most common, and the range is largest minus smallest.
- In a bar chart the bars do not touch, but in a histogram they do. A normal distribution is a bell-shaped curve with the mean, median and mode very similar.
Exam Skills
- If asked to evaluate the research method, give its strengths and weaknesses, not those of the study or the design. Link every point to the scenario.
- In a design question, answer each bullet in order. In a calculation, show your working and round as asked. A graph needs a title naming both variables.
Formulation of Testable Hypotheses
A hypothesis is a prediction that a study can test. Researchers write it before they collect any data. See what is a hypothesis.
Every hypothesis compares conditions.
A condition is one version of the situation that participants, the people who take part, experience. A hypothesis also names something that can be measured. The course specification, which is AQA’s list of what you must learn, names two kinds.
Imagine a study of whether music changes how many maths questions people answer correctly in five minutes. The two conditions are listening to music and working in silence.
Null Hypothesis
The null hypothesis predicts that there is no difference between the conditions. It must still name both conditions and something measurable.
In the music study, a null hypothesis is:
There will be no difference in the number of maths questions answered correctly in five minutes between people who listen to music and people who work in silence.
The exam also credits a shorter form that says one thing “will not affect” another. For example: “Whether people listen to music or work in silence will not affect the number of maths questions they answer correctly in five minutes.” It still names both conditions and the measure.
Alternative Hypothesis
The alternative hypothesis predicts a difference between the conditions. The word “alternative” does not mean “another idea”. It means the prediction the researcher actually expects.
In the music study, an alternative hypothesis is:
There will be a difference in the number of maths questions answered correctly in five minutes between people who listen to music and people who work in silence.
You can also say which group will do better, for example that people who work in silence will answer more questions correctly. The exam credits both forms.
Two marks need both conditions and a clear, measurable outcome. Psychologists call a clear, measurable outcome “operationalised”. One mark is for a statement that lacks clarity.
Mistakes That Lose Marks
- A Vague Measure: “Perception”, “performance” or “better” cannot be counted. Use a score, a rating or a count.
- One Condition Only: Both conditions must appear. “Music improves maths” does not name the comparison.
- An Aim or a Question: “To find out if music helps” is an aim, not a hypothesis. A null hypothesis, or an idea for further research, is also the wrong kind.
- A Result: Words such as “was” or “did” report what happened. A hypothesis predicts.
- A Correlation Statement: “More sleep goes with higher marks” is not an experiment hypothesis. An experiment compares two conditions and measures an outcome.
Types of Variable
A variable is anything that can change or be measured.

Independent Variable
The independent variable (IV) is the thing the researcher changes or compares. In the music study it is listening to music or working in silence. Each version is a condition.
Name both conditions. “Early or late school start” earns the mark. A topic word on its own, such as “mindset” (a belief about whether ability can change), does not, because it names no comparison.
Dependent Variable
The dependent variable (DV) is the thing the researcher measures. It may change because of the independent variable. In the music study it is the number of maths questions answered correctly in five minutes.
A dependent variable must be measured, so it must be clear. A score, a count or a rating works, such as the number of words recalled. “Performance” does not. In one past question, “estimated distance in metres” earned two marks. “Distance” alone earned one.
Read variables for more examples.
Extraneous Variables
An extraneous variable is anything other than the independent variable that could change the dependent variable. It spoils the comparison. The researcher cannot tell what caused the change.
In the music study, noise in the room, the time of day and the difficulty of the questions are all extraneous variables.
So is a participant variable, which is a difference between the people, such as intelligence or mood.
In the exam you get marks for naming an extraneous variable and a way to control it. Research Procedures shows how. See extraneous variables.
Sampling Methods
Psychologists cannot study everyone, so they choose a few people. How they choose decides whether the findings can be trusted. See sampling.
Target Populations and Samples
The target population is the group the research is about. For example, all Year 8 students in a school.
A sample is a small group taken from the target population and used by the researchers. A representative sample is a fair copy of the target population. Its findings can be generalised, which means applied to the whole target population.
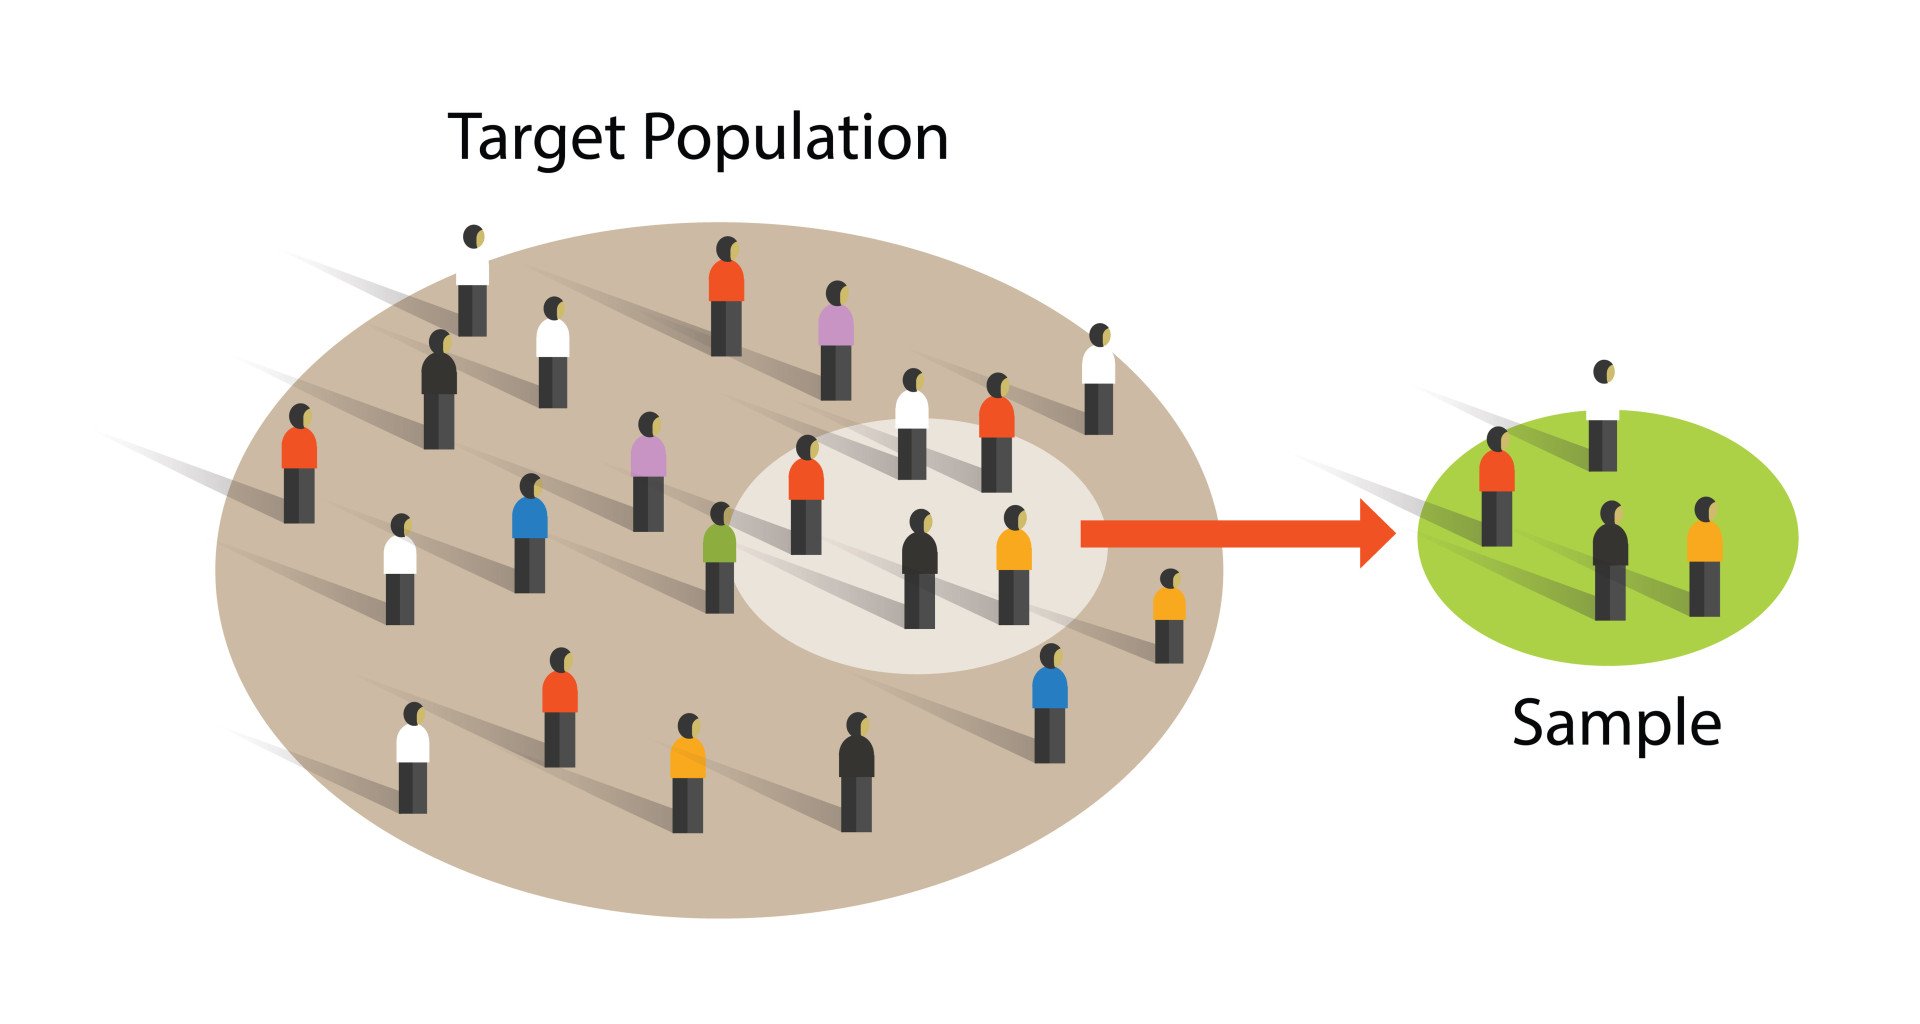
Bias in sampling means an unfair choice of people. The four methods in the specification differ in how much bias they allow.
Random Sampling
In random sampling, every member of the target population has an equal chance of being picked.
To do it, list all the members and number them. Then choose with a hat or a random number generator. Stop when you reach the sample size.
Random allocation, covered under Research Procedures, is a different idea. Do not mix them up.
Strengths of Random Sampling
- Bias: The researcher cannot choose who is picked, so there is no researcher bias.
- Representative: Everyone has an equal chance, so the sample is likely to reflect the target population.
Weaknesses of Random Sampling
- Time and Effort: The researcher needs a full list and must contact the people picked. This takes more time and resources.
- Refusals: Some people picked may say no. This reduces the sample.
Opportunity Sampling
In opportunity sampling, the researcher asks members of the target population who are willing and available. They might be people in a street, a school or a workplace.
Strengths of Opportunity Sampling
- Quick and Easy: The researcher uses anyone who is available, so it saves time.
Weaknesses of Opportunity Sampling
- Bias: The researcher chooses who to ask, so there may be bias.
- Representative: The sample is often unrepresentative, so the findings are harder to generalise.
- Helpful Participants: People who know the researcher may try to help by behaving as they think is wanted.
Systematic Sampling
In systematic sampling, the researcher takes every nth member of an ordered list. For example, they might take every 10th employee until they have enough.
Imagine a list of 400 students and a sample of 40. Divide 400 by 40 to get 10. Take every 10th name.
Strengths of Systematic Sampling
- Bias: Once the list and the number are fixed, the researcher cannot influence who is picked. There is less bias than in opportunity sampling.
- Representative: It is usually more representative than opportunity sampling.
Weaknesses of Systematic Sampling
- Time: The researcher needs a full list. This takes longer than asking whoever is available.
- Subgroups: Some groups may be missed or over-represented, so the sample may not match the target population.
Stratified Sampling
In stratified sampling, the researcher first identifies the subgroups, which are called strata. They then pick at random from each subgroup, in proportion to its size.
Imagine a school of 500 students. There are 300 in Years 7 to 9 and 200 in Years 10 and 11. The sample is 50.
Work out the shares. 300 out of 500 is 30 of the 50. 200 out of 500 is 20. Pick 30 at random from the first group and 20 at random from the second.
Strengths of Stratified Sampling
- Representative: Every subgroup is included in the right proportion, so the findings can be generalised better.
- Bias: Choosing at random within each subgroup reduces bias.
Weaknesses of Stratified Sampling
- Time and Effort: It is difficult and slow. The researcher must find the subgroups and work out the proportions.
- Choosing Subgroups: The researcher may be biased about which subgroups to include.
- Refusals: Some people picked may refuse.
See stratified sampling.
Understanding Principles of Sampling as Applied to Scientific Data
The more a researcher can influence who is chosen, the greater the risk of bias. Opportunity and systematic sampling are unlikely to give a fully representative sample.
Some groups may be missed or over-represented. A sample from one culture or age group may not apply to other people.
When a question asks for “a sampling method”, the exam also accepts volunteer, self-selected, convenience and snowball sampling.
In volunteer sampling, people put themselves forward, for example by answering a poster. See convenience sampling.
Designing Research
A research method is how a study collects its evidence.
This section covers quantitative and qualitative methods, the experimental method, interviews, questionnaires, case studies and observation studies.
Two words come up in every evaluation. Reliability means you would get consistent results if you repeated the study.
Validity means the study measures what it claims to measure, or is true to real life. Planning and Conducting Research explains both.
Quantitative and Qualitative Methods
A quantitative method gives numerical data, such as scores or counts. A qualitative method gives non-numerical data, such as descriptions in people’s own words.
Any research method can be quantitative or qualitative. What matters is whether the task produced numbers or descriptions. A strength of qualitative data is that people use their own words and are not limited to fixed answers, so the data can be more valid.
Do not say qualitative data always has more detail or depth. The exam does not credit that, because it is not always true.
The Experimental Method: Experimental Designs
In an experiment, the researcher changes the independent variable and measures the effect on the dependent variable.
If the researcher controls the extraneous variables, an experiment can test cause and effect. See controlled experiments.
An experimental design is how participants are shared between the conditions. There are three. Do not mix up the design with the research method. See experimental designs.
Two terms help here. Order effects are changes caused by doing one condition before another, such as practice or tiredness. Participant variables are differences between people, such as intelligence.
Independent Groups
In an independent groups design, different participants do each condition. See between-subjects design.
Strengths of Independent Groups
- No Order Effects: Each person does only one condition, so practice or boredom cannot affect the second one.
- Demand Characteristics: People are less likely to work out the aim, because they see only one condition. Demand characteristics are clues about the aim that make people change what they do.
Weaknesses of Independent Groups
- Participant Variables: The two groups may differ, for example in intelligence. A difference in results might come from the people, not the independent variable.
- More Participants: The researcher needs twice as many. Ten per condition means 20 people.
A question may ask you to discuss the reliability and validity of independent groups. Discuss both. One alone limits you to two of three marks. Points that never mention either earn one mark at most.
- Participant Variables: Less valid, because a difference may come from the people. Less reliable, because a repeat with different people may give different results.
- No Order Effects: More valid and more reliable than repeated measures. Practice and boredom cannot change the results, so a repeat should give similar results.
- Fewer Demand Characteristics: More valid and more reliable than repeated measures. People who do one condition are less likely to work out the aim.
Repeated Measures
In a repeated measures design, the same participants do every condition. See within-subjects design.
Strengths of Repeated Measures
- No Participant Variables: The same people take part in both conditions, so the results compare directly.
- Fewer Participants: The researcher needs half as many people, which is cheaper and quicker.
Weaknesses of Repeated Measures
- Order Effects: Practice, boredom or tiredness may change the second set of scores.
- Demand Characteristics: People see both conditions, so they are more likely to work out the aim.
The fix for order effects is counterbalancing, where half the group does the conditions in the opposite order. Research Procedures explains it.
Matched Pairs
In a matched pairs design, different participants do each condition. They are paired by something that could affect the dependent variable, such as age or ability. One person in each pair goes into each condition.
Imagine a teacher pairs students with the same score on the last maths test. One in each pair tries a new revision method. The other uses the old one.
Strengths of Matched Pairs
- Fewer Participant Variables: The people in the two conditions are similar on the feature that was matched.
- No Order Effects: Each person does only one condition.
Weaknesses of Matched Pairs
- Time-Consuming: The researcher must collect matching data first, which is difficult.
Laboratory Experiments
A laboratory experiment takes place in a controlled but artificial setting. The researcher sets up the place and the task.
Gilchrist and Nesberg (1952) is an example. One group went without food for 20 hours. Then everyone judged the brightness of four food slides, each shown for 15 seconds. See Gilchrist and Nesberg’s study.
Bruner and Minturn (1955) is another. The exam describes it as a laboratory experiment with 24 participants and an independent groups design. See Bruner and Minturn’s study.
Strengths of Laboratory Experiments
- Control: The researcher removes many extraneous variables, so it is easier to show how the independent variable affects the dependent variable.
- Standardised Procedures: A standardised procedure gives everyone the same instructions and conditions. The study is easy to repeat, so results are more reliable. Showing each food slide for 15 seconds was standardised.
Weaknesses of Laboratory Experiments
- Ecological Validity: Artificial tasks and settings lower ecological validity, which is how well the results fit everyday life. Judging the brightness of food slides is not an everyday task.
- Unnatural Behaviour: Participants know they are in a study and may not behave as they normally would. The exam credits this as a reliability point. Name the concept the question asks about.
- Generalisability: High control can make behaviour artificial, so the findings are hard to apply to other settings.
- Trivial Tasks: Ethics limits what researchers can ask people to do, so tasks may be trivial.
- Ethics: In Gilchrist and Nesberg’s study, going 20 hours without food may cause discomfort.
Field and Natural Experiments
A field experiment changes the independent variable and measures the dependent variable in an everyday setting, such as a school playground.
Piliavin’s subway study is the exam’s example. A man pretended to collapse on a New York subway train. Hidden observers recorded whether and how fast passengers helped (Piliavin et al., 1969). The passengers did not know they were being studied, so it is called covert.
In an answer, link your point to the study. Naming it is not enough.
Bickman (1974) is another field experiment, in which a man gave pedestrians short orders in the street. See Bickman’s uniform study.
In a natural experiment, the independent variable changes naturally, outside the researcher’s control. Imagine a school changes its start time on its own decision. A researcher then compares absence before and after.
Strengths of Field and Natural Experiments
- Ecological Validity: The setting and the tasks are realistic, so the results are more likely to fit everyday life.
- No Demand Characteristics: In a field experiment, people are often unaware they are being studied. They cannot work out the aim.
- Ethical Limits Avoided: A natural experiment lets researchers study an event they could not set up themselves.
Weaknesses of Field and Natural Experiments
- Ethics: In a field experiment, people may not have agreed to take part. They do not know they can withdraw.
- Less Control: Extraneous variables get in. It is harder to standardise the procedure and to repeat the study.
- No Control of Groups: In a natural experiment, the researcher cannot control who is in each condition. The groups may differ in other ways.
- Cost: Field experiments are not cheaper. Real-world settings are complex, so costs are often higher.
Interviews
An interview collects data by asking people questions, face to face, by phone or by video link. This means a research interview, not a job interview.
- A structured interview uses set questions in the same order for everyone.
- A semi-structured interview has some set questions, then follow-up questions.
- An unstructured interview starts with a few prepared questions. New ones grow out of the answers.
Interviews suit questions about personal experiences, views and feelings.
Strengths of Interviews
- Detail: Interviews give much information, especially unstructured ones. The data are often qualitative and detailed.
- Easy to Compare: Structured interview answers are easy to put together and compare.
- Depth: Semi-structured interviews allow follow-up questions, so the interviewer can explore interesting answers.
- Suits Some People: Interviews suit people who cannot write well.
- Ecological Validity: An unstructured interview is like a conversation, so it feels natural.
Weaknesses of Interviews
- Truthfulness: The researcher cannot check whether people are honest. They may answer the way that makes them look good.
- No Follow-Ups: A structured interview allows no extra questions.
- Slow to Analyse: An unstructured interview may produce irrelevant data, which takes a long time to sort.
In a design question about an interview, write a question for the group named. If you will interview staff who use a machine, ask the staff, not patients. Give ethics for the interview, not for the machine.
Questionnaires
A questionnaire is a set of written questions. Closed questions have fixed answers. Open questions let people write what they like. Say which kind you mean in an answer. See questionnaires.
Strengths of Questionnaires
- Large Samples: A researcher can reach many people quickly. A large sample is easier to generalise.
- Easy to Analyse: Closed questions give answers that are easy to count and compare.
- Flexible: A questionnaire can be done online, by phone, on paper or face to face, and is quick to run once written.
- Honesty: Privacy and anonymity may make people more honest.
- Consent: People know they are completing a questionnaire, which deals with consent.
- No Investigator Effects: The researcher is not there to influence the answers. This influence is called an investigator effect.
Weaknesses of Questionnaires
- Social Desirability: People may answer the way that makes them look good.
- Accuracy: The researcher cannot check whether people lie or remember wrongly.
- Closed Questions: Fixed answers limit what people can say.
- Leading Questions: Wording that pushes people towards an answer lowers validity.
- No Clarification: Nobody can ask what a confusing question means. Only some people reply.
Apply each point to the scenario. Imagine a questionnaire asks students how much they chat in lessons. They may report less chatting than really happens, to look good. Name the kind of question or how it is delivered, for example “closed questions”.
Be ready to write questions. A quantitative question gives numerical answers, including yes or no and “how many”. A qualitative question asks for descriptions.
Case Studies
A case study is an in-depth investigation of a unique individual, group, organisation or situation. You need both parts: in-depth and unique.
Case studies suit unique or rare groups studied closely over time. See case studies. Penfield’s study of the interpretive cortex is the exam’s example. It studied patients with severe epilepsy who had awake brain surgery (Penfield, 1959). See Penfield’s study.
Strengths of Case Studies
- Rich Detail: The researcher gets detailed information about one case.
- Rare Behaviour: Case studies can study unusual behaviour that cannot be set up in an experiment.
- Over Time: They can follow behaviour as it changes.
- Unexpected Results: Surprising findings can appear, because questions are not fixed.
- Shows the Normal: Studying unusual cases helps us understand what is normal.
Weaknesses of Case Studies
- Generalisability: The findings cannot easily be applied to a wider population.
- Replication: A unique case is not easy to repeat, so the study cannot easily be replicated.
- Confidentiality: Unique people may be identified. Penfield used initials, but one patient could still be identified later.
Observation Studies: Categories of Behaviour and Interobserver Reliability
An observation is watching and recording behaviour. In a naturalistic observation, the behaviour happens in its normal setting.
In a controlled observation, the researcher arranges the setting. Observation suits what people actually do, and behaviour that young children cannot describe. See observation.
Categories of Behaviour
Categories of behaviour are the clear, separate behaviours that observers agree to record. Each must be measurable. It must suit the age watched.
Imagine observing babies under two years old. Kicking, thumb sucking, clapping and pointing are suitable. “The baby is happy” is too vague, because two observers may not agree what happy looks like.
Observers record each category on a frequency table, also called a tally chart. Data Handling shows how to draw one.
Interobserver Reliability
Interobserver reliability is how closely the record sheets of two or more observers match. Both parts matter: two or more observers, and matching records.
To check it, take these steps:
- Give the observers the same record sheet.
- Have them watch the same group at the same time.
- Compare their data. With two observers, a correlation can show how similar the data are.
- If the match is poor, change the categories and repeat.
Strengths and Weaknesses of Observations
These are general points, so link each one to the study in the question.
- Ecological Validity: In a naturalistic observation, behaviour is recorded as it really happens, so validity is high.
- Observer Bias: An observer may see what they expect. Clear categories and an interobserver check reduce this.
- Awareness and Ethics: In an overt observation, people know they are watched and may change their behaviour. In a covert one, they cannot consent.
For children, the exam credits three ways of dealing with ethics. Ask parents to sign a consent form. Be ready to stop if a child is distressed. Do not name the children.
Correlation
Association Between Two Variables
A correlation is an association between two co-variables. Both are measured. Neither is changed by the researcher. So a correlation has no independent or dependent variable. A hypothesis for a correlation predicts a link between the two co-variables.
- A positive correlation means both co-variables rise together. For example, more exercise goes with higher well-being.
- A negative correlation means one rises as the other falls. For example, more hours on social media go with fewer hours reading.
- No correlation means there is no pattern.
- A perfect correlation means every dot lies on one straight line. It is a wrong option in multiple-choice questions, so check the pattern first.
You do not need to calculate a correlation with a formula. See correlation.
Scatter Diagrams for Correlational Relationships
A scatter diagram has one dot for each person. The dot sits where that person’s two scores meet. Dots rising from left to right show a positive correlation. Dots falling show a negative one. A cloud with no pattern shows none.
A scatter diagram shows a possible relationship, not a proven one.
Strengths of Correlations
- Ethics and Practicality: Researchers can study relationships without changing anything. This suits topics where an experiment would be unethical or impractical.
- A Starting Point: A correlation can suggest ideas for later experiments.
- Curved Patterns: It can reveal patterns that are not straight lines, such as stress and performance.
Weaknesses of Correlations
- Cause and Effect: A correlation cannot show that one variable causes the other, because a third variable may explain the link. Giving only “cannot show cause and effect” earns little. Explain why.
- Direction: It does not show which variable caused the other, or why.
- Sample Size: A correlation needs a lot of data, because small samples may give unreliable results. Collecting a large data set is time-consuming and expensive.
In the exam, apply the point to the scenario. For example, a calm home life could explain both more sleep and higher grades.
Research Procedures
Where to find it: standardised procedures and extraneous variables are in this section. Reliability and validity are in Planning and Conducting Research. The mean, median, mode and range are in Data Handling, under Descriptive Statistics.
Standardised Procedures
A standardised procedure gives every participant the same instructions and conditions, apart from the independent variable.
The exam credits the same instructions, the same environment, and the same briefing and debrief. A briefing is what participants are told before. A debrief is the full explanation afterwards.
The benefit is that only the independent variable can affect the dependent variable. Cause and effect can be shown. The study is also easier to repeat, which raises reliability.
Instructions to Participants
Instructions to participants are what they are told before and during the study.
Standardised instructions mean everyone hears the same words, for example read from a script.
Randomisation
Randomisation means using chance to choose the order of things, such as photographs. Number five photographs 1 to 5. Use a random number generator, or numbers drawn from a bag, to pick the first. Repeat until all five are placed.
Randomisation is not random sampling. One chooses an order. The other chooses people.
Allocation to Conditions
Allocation to conditions is deciding which participants go in which condition. Random allocation does this by chance. It reduces the effect of participant variables, because the differences between people should be spread across the groups.
Imagine 30 names drawn from a hat. The first 15 drawn go into condition A and the rest into condition B. Do not describe this when a question asks about random sampling. See random allocation.
Counterbalancing
Counterbalancing goes with repeated measures. Half the group does condition A then B. The other half does B then A.
It avoids order effects. So the researcher can be more confident that the independent variable caused the results.
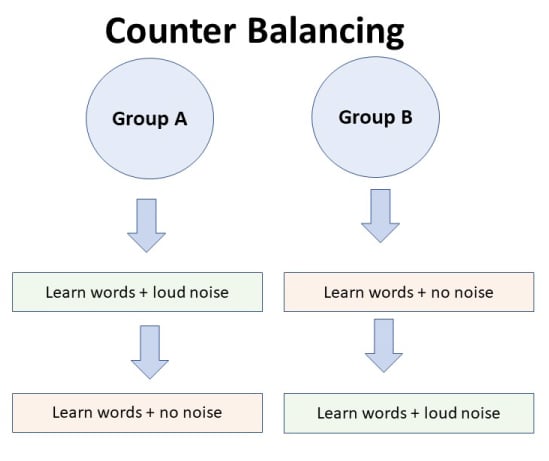
Extraneous Variables: Their Effect and How to Control Them
An extraneous variable changes the dependent variable. The researcher can then not be sure the independent variable caused the change. The researcher controls it by keeping it the same for everyone.
- A Word List: Use common words, the same learning time and the same font.
- Environment: Use the same room.
- Time of Year: In a park study, weather, school holidays and time of year could all affect the results.
- Participant Variables: Use random allocation, matched pairs or repeated measures.
Planning and Conducting Research
A good researcher plans with reliability and validity in mind. The specification links both to sampling methods, experimental designs, and quantitative and qualitative methods. Both are explained here.
Reliability
Reliability means consistency. If you repeated the study, you would get similar results. Standardised procedures and the same materials make repeating easy, so they raise reliability.
Interobserver reliability is the same idea for observers.
The exam also credits “participants may not behave as they normally would” in a laboratory as affecting reliability. Name the concept the question asks about, then explain it.
Validity
Validity means the study measures what it claims to measure, and the conclusion can be trusted. See reliability and validity.
The exam credits counterbalancing as raising validity. It avoids order effects, so the researcher can trust that the independent variable caused the data. Questionnaires may be invalid when answers cannot be checked or people answer to look good.
Three related ideas appear in answers. See demand characteristics too.
- Generalisability: How far the results apply to other people. Opportunity samples, one culture, one era and case studies limit it.
- Social Desirability: Answering the way that makes you look good. It matters most for interviews and questionnaires.
- Researcher Bias: The researcher’s choices affect who is picked or how results are read. Opportunity sampling allows it.
Planning With Sampling, Designs and Methods
Random and stratified sampling give more representative samples, so findings can be generalised better. Opportunity sampling is quick but may be biased.
Use counterbalancing with repeated measures. Use random allocation with independent groups to spread participant variables. Fixed answers are easy to analyse but may limit what people say.
Ethical Considerations
Ethical issues are rules that protect participants. The specification points to the guidelines of the British Psychological Society (BPS), the professional body for psychologists in the UK.
The BPS code names four principles: respect, competence, responsibility and integrity.
In the exam you get marks for naming an issue and a way of dealing with it that fits the study. See ethics in psychology.
Ethical Issues and the BPS Guidelines
- Informed Consent: People agree to take part after being told what is involved. See informed consent.
- Parental Consent: A parent agrees on behalf of a child.
- Deception: Lying to or misleading participants.
- Right to Withdraw: Participants can stop at any time.
- Protection From Harm: The risk to participants is no greater than in everyday life. Harm is not only physical.
- Confidentiality: Keeping people’s identities private.
- Debrief: A full explanation at the end of the study.
- Respect, Competence, Responsibility and Integrity: These are the four BPS principles. No particular way of dealing with them is printed, so use the general ways below where they fit.
Ways of Dealing With Each of These Issues
- Informed Consent: Explain what they will be taking part in and ask if they are happy to do so.
- Parental Consent: If participants are under 16, ask their parents for permission. Ask parents to sign a consent form.
- Deception: Tell participants as soon as possible if they were lied to.
- Right to Withdraw: Tell them before and during the study that they can stop at any point. Tell them afterwards that they can remove their results.
- Protection From Harm: Make sure the risk is no greater than in everyday life. Stop if a child is distressed.
- Confidentiality: Do not use names in any report. Use a number or a letter. Give no identifying details, such as where a group meets.
- Debrief: After the study, explain what they took part in, why, and how the results will be used.
Marks go to a way that fits the issue and the study. “Ask for consent” does not deal with confidentiality. Say “informed” consent, because people must know what they are agreeing to. Apply your point to the people in the scenario.
A question may ask you to justify deception in conformity research, which studies when people go along with a group. Two reasons are credited.
If people knew the pressure was not real, the effect would shrink and the findings would be less valid. People who know the aim may also help or hinder the researcher.
Data Handling
Studies produce numbers, and psychologists must sum them up and show them. A calculator is allowed in the exam.
The exam board’s separate maths list is not exactly the same as this content. It adds range as a measure of how spread out scores are, translating between graphs and numbers, and plotting and interpreting graphs of two variables.
Quantitative and Qualitative Data
Quantitative data are numbers, and qualitative data are descriptions, as Designing Research explained. Words do not make data qualitative. Imagine observers tally “smiling” and “frowning” on a record sheet. The answers are words, but they are counted. So the data are quantitative.
Imagine a researcher asks students to describe how revision makes them feel. The answers are descriptions that cannot be counted. These data are qualitative.
To justify qualitative data, point to the words in the question. See qualitative and quantitative data.
Primary and Secondary Data
Primary data are collected first-hand. The researcher gathers them from participants for the study. Secondary data were collected earlier by someone else. Examples are published records and official figures, such as those from the Office for National Statistics.
A question asking for the difference earns marks only for an explicit comparison. Use a contrast word: primary data are collected by the researcher for this study, whereas secondary data were collected earlier by someone else.
Answers to your own questionnaire are primary data. Published school attendance figures are secondary data.
Computation
Computation means working with numbers: decimals, standard form, ratios, fractions, percentages, estimating and significant figures.
Decimal Form and Standard Form
A number in decimal form is written with digits and a decimal point, such as 0.25 or 3,200.
Standard form writes a number as a number between 1 and 10, multiplied by a power of ten. Imagine 3,200. Move the decimal point three places to get 3.2. So 3,200 is 3.2 × 10³. A small number uses a negative power. So 0.0045 is 4.5 × 10⁻³.
Ratios, Fractions and Percentages
A fraction shows a part of a whole. A percentage is a fraction out of 100. Divide the part by the whole and multiply by 100.
Imagine 6 of 24 students chose option A. That is 6/24, or 1/4 in its simplest form. As a decimal it is 0.25. As a percentage it is 25 per cent.
A ratio compares two amounts. Imagine 15 boys and 10 girls. The ratio is 15:10. Divide both numbers by 5 to get 3:2. Keep the order the question gives.
You may need a fraction of a total. Imagine two fifths of 200 students walk to school. How many do not? Two fifths is 0.4, so 1 − 0.4 = 0.6 do not walk. Then 0.6 × 200 = 120.
You may need a missing value from a total. Imagine 40 students gave a rating. The table shows 29 rated 1 to 5. Those who rated 6 to 10 number 40 − 29 = 11.
Estimating Results
To estimate, round each number to one easy figure, then calculate. For 4.9 × 21, use 5 × 20, which is 100. A calculator answer of 102.9 is sensible.
You can also estimate a value between two known values. Imagine a table shows 4 at 10 hours. It shows 8 at 30 hours. So the value at 20 hours is about 6.
On a scatter diagram, read across from one axis to the dots. A number or a short range is accepted, if it fits the pattern.
Significant Figures
Significant figures are the digits you keep when you round. Count from the first digit that is not zero. Round up when the next digit is 5 or more.
- 37.5 to two significant figures is 38, not 37.
- Imagine 29.1666. To two significant figures it is 29. To one it is 30.
- Imagine 0.004567. The first digit that is not zero is 4. Keep 4 and 5. The next digit is 6, so round the 5 up. The answer is 0.0046.
In one past question, the mean 80.6 had to be given as 81. Giving 80.6 lost a mark. Examiners say this is the commonest maths mistake. You can still earn marks for correct working, so always show it.
Descriptive Statistics
Descriptive statistics sum up a set of scores in one number. The mean, median and mode are measures of the middle, which is the typical score. The range shows how spread out the scores are. Imagine five students’ test scores: 3, 5, 5, 7 and 10.
Mean
The mean is the total of all the scores divided by how many scores there are. Here, 3 + 5 + 5 + 7 + 10 is 30. Divide 30 by 5. The mean is 6.
Median
The median is the middle score, in order. In the example it is 5.
Some sets have an even number of scores. Then take the number halfway between the middle two. Be careful here. Imagine 4, 6, 7 and 9. The middle two are 6 and 7. The median is 6.5.
In one Paper 2 question, only half of students found the median. Many were unsure about an even number of scores. Others gave the mean.
In a Paper 1 question, most students knew the answer was “median”. Some misspelled it or mixed it up with the mode. Learn the spelling.
Mode
The mode is the most common score. In the example, 5 appears twice and the others appear once. The mode is 5.
Range
The range is the largest score minus the smallest. In the example, 10 − 3 is 7. Use this subtraction in the exam. Some questions also accept a version that adds one, so always show your working.
Interpretation and Display of Quantitative Data
Graph questions give one mark for each clear step. They differ, so read the question. Most credit:
- a suitable type of graph
- a title that names both variables
- both axes labelled, and a suitable scale
- correct plotting
“Sketch” means a rough drawing is enough. If a score you worked out earlier was wrong, you can still earn the plotting mark by plotting it correctly.
Frequency Tables
A frequency table shows how often each score, or group of scores, occurs. Imagine 30 students sat a test out of 24. Their scores were grouped.
| Score | Tally | Frequency |
|---|---|---|
| 0 to 4 | II | 2 |
| 5 to 9 | IIIII I | 6 |
| 10 to 14 | IIIII IIIII IIII | 14 |
| 15 to 19 | IIIII I | 6 |
| 20 to 24 | II | 2 |
Check the total. 2 + 6 + 14 + 6 + 2 is 30.
In a table you draw yourself, use rows, columns and a heading such as “tally” or “frequency”. In the tally column, each I is one score. On paper, a line through four marks makes a group of five.
Bar Charts
A bar chart shows separate categories, such as two conditions. The bars do not touch. If they touch, you get no plotting credit.
If the bars show mean homework time, label the vertical axis “mean time on homework in minutes”. Write “mean” because means are plotted. If you plot medians, say “median” in the same way.
Histograms
A histogram shows grouped scores on a number line. The bars touch, and every bar has the same width. Gaps mean no credit for a suitable graph. The vertical axis is “frequency”, the number of people.
For the table above, draw a bar for each score group. The heights are 2, 6, 14, 6 and 2.
A suitable title is “A histogram to show the test scores of 30 students”. A title such as “Condition A” earns no mark, because it does not name both variables.
Scatter Diagrams
A scatter diagram shows a possible correlation. Each person is one dot. Put one co-variable on each axis.
The title must name the relationship. It must name both variables. For example: “A scatter diagram to show the relationship between hours of revision and test score”. A title such as “How revision affects scores” lost marks in one past question.
If each dot shows a mean, write “mean” in the label of both axes. Any other display earns no marks.
Interpreting a Graph or Table
Use the numbers. Imagine mean recall was 5 words in group A and 11 in group B.
- Good: Group B recalled 11 words on average, against 5 for group A.
- Weak: Group B did better.
A finding is what the numbers show. A conclusion is what that means. A finding: group B recalled more. A conclusion: learning in small chunks may help recall.
You may be given means and ranges. Use both. A lower or higher mean shows which condition did better. Equal ranges show a similar spread of scores. So the difference probably comes from the independent variable, not from differences between people.
Normal Distributions
A normal distribution is a symmetrical, bell-shaped curve. Most scores are in the middle, and fewer are at each end. The mean, median and mode are very similar, or the same. See normal distribution.
The frequency table above is close to a bell shape. The middle group has the most students, and the two ends are equal.
“Normal distribution” and “bell curve” are both accepted. You may have to sketch one: draw a smooth bell shape and mark the mean.
How the Exam Asks About Research Methods and Data Handling
Research methods is Section D of Paper 1, worth 25 marks. Its questions also appear in every topic on both papers. Examiners say at least 20 per cent of all marks reward research methods and at least 10 per cent reward maths skills.
Most Section D marks reward applying your knowledge to the scenario in the question. Knowing the definition is not enough.
Command Words
- Name or Identify: Give the technical term. For “identify”, your own words are also accepted.
- Justify: Support your answer with evidence. A definition alone is limited.
- Explain: Give a reason. A description is not enough.
- Outline: Give the main points, not just a name.
- Evaluate: Give strengths and weaknesses with reasons. Do not describe.
- Describe and evaluate: Give both. About half the marks are for each.
- Sketch: A rough drawing or plot is enough.
- Design: Follow the bullet points in order. Only the bullets earn marks.
What Examiners Look For
- Method, Design, Sampling: Students often mix these up. Four different questions get four different answers, as the table shows.
- A, M, R and C: To describe a study, give the aim, method, results and conclusion. Many students describe only the method.
- Evaluate the Research Method: If asked to evaluate the method, evaluate it, for example the laboratory experiment. Evaluating the independent groups design or the study earns almost nothing.
- Apply to the Scenario: Generic points are capped. Follow each point with its application.
| Question asked | Name | Examples |
|---|---|---|
| How was the evidence collected? | Research method | experiment, interview, questionnaire, case study, observation |
| What kind of experiment was it? | Type of experiment | laboratory, field, natural |
| How were people shared between conditions? | Experimental design | independent groups, repeated measures, matched pairs |
| How were people chosen from the target population? | Sampling method | random, opportunity, systematic, stratified |
What a Design Question Asks For
Marks go only to the bullets. These are the bullets the exam has set.
- A Hypothesis That Fits Your Design: Write one for the experiment you described.
- A Standardised Procedure and Its Benefit: For example, the same instructions and room. Only the independent variable then affects the dependent variable.
- An Ethical Issue and a Way of Dealing With It: The way must match the issue and the people in the study. Each pair earns up to two marks.
- Target Population, Sampling Method and How to Do It: Each earns a mark. A poster asking for volunteers is credited.
- Type of Experiment and Design: For example, a field experiment with independent groups.
- Expected Results: Give a result for both conditions. “Group 1” and “Group 2” limit the answer to one mark.
- Base, Do Not Retell: Base your design on a known study. Retelling it earns at most one mark.
Laboratory and Field Experiments in a 9-Mark Question
A 9-mark question can ask you to outline both laboratory and field experiments. You then use one published experiment to discuss strengths and weaknesses.
- Outline both types in one or two sentences each.
- Choose laboratory or field experiments. If you write about both, the examiner marks the clearer one.
- Give a strength and a weakness, each with what happened in one named study.
Without a published study, you earn at most 1 of the 5 evaluation marks. Just naming one does not count.
Practice Question 1: Hypothesis and Variables (4 marks)
Imagine a teacher thinks students learn spellings better when they say them aloud than when they read them silently. These practice questions are examples, not the exam board’s own wording.
- (a) Write an alternative hypothesis. [2 marks]
- (b) Identify the independent variable and the dependent variable. [2 marks]
Model answer:
- (a) There will be a difference in the number of spellings correct in a test of 20 words between students who say the words aloud and students who read them silently.
- (b) The independent variable is saying the words aloud or reading them silently. The dependent variable is the number of spellings correct out of 20.
- Marking note: The hypothesis needs both conditions and a measurable outcome. “Better spelling” is too vague.
Practice Question 2: Stratified Sampling (3 marks)
Imagine a school council wants to know what Year 10 think about lunch times. Year 10 has 180 students: 100 girls and 80 boys. Describe how to select a sample of 18 using stratified sampling. [3 marks]
Model answer: The target population is all 180 Year 10 students. I would use stratified sampling. I would split them into girls and boys.
Girls are 100 out of 180, so I need 10 girls. Boys are 80 out of 180, so I need 8 boys. I would pick them from numbered lists using a random number generator.
- Marking note: One mark each for a fitting target population, a named method and a way of carrying it out that fits both.
Practice Question 3: Design an Experiment (6 marks)
Imagine this question. Describe how you would design an experiment to investigate the effect of background noise on memory. In your answer, include:
- the task and the data you would collect
- the experimental design and why you chose it
- one extraneous variable and how you would control it
- the results you expect. [6 marks]
Model answer: Participants would study 15 words for two minutes, then write down as many as they can remember. The data are the number of words recalled. One group would work in a quiet room. The other would work with recorded traffic noise.
I would use independent groups, so nobody sees the same list twice. This avoids order effects. I would allocate people to groups at random to spread out participant variables.
An extraneous variable is the difficulty of the words, so both groups get the same list. I expect the quiet group to recall more words than the noise group.
- Marking note: Marks go to the bullets. Up to two marks are for expected results, one for each condition.
Practice Question 4: Evaluate a Questionnaire (4 marks)
Imagine a researcher uses a questionnaire to ask 300 students how many hours a day they spend on social media. Evaluate the use of a questionnaire. [4 marks]
Model answer: One strength is that a questionnaire reaches 300 students quickly. So the findings are easier to generalise.
One weakness is social desirability. Students may report fewer hours than they really spend, to look good. So the data may not be valid.
- Marking note: Each point needs its application to the study. A generic point earns one mark.
Practice Question 5: Ethics (4 marks)
Imagine a researcher wants to observe Year 7 students in the playground at lunchtime. Name two ethical issues. For each, explain one way of dealing with it. [4 marks]
Model answer: One issue is parental consent. The students are under 16, so I would ask their parents to sign a consent form. Another issue is confidentiality. I would not use the students’ names in my report. I would give each student a number.
- Marking note: The way must match the issue. “Confidentiality” with “ask for consent” earns nothing.
Practice Question 6a: Mean, Median, Mode and Range (5 marks)
Imagine ten students’ memory scores out of 20: 7, 9, 12, 9, 15, 11, 9, 14, 10, 13. These scores are invented.
- (a) Calculate the mean to two significant figures. [2 marks]
- (b) Find the median, the mode and the range. [3 marks]
Model answer:
Part (a): add the scores to get 109. Divide by 10 to get 10.9. To two significant figures, the mean is 11.
Part (b): in order, the scores are 7, 9, 9, 9, 10, 11, 12, 13, 14 and 15. The middle two are 10 and 11, so the median is 10.5. The mode is 9. The range is 15 − 7, which is 8.
- Marking note: Working earns marks even if an answer is wrong.
Practice Question 6b: Percentage, Ratio and Histogram (6 marks)
Use the same ten memory scores as Practice Question 6a.
- (c) What percentage of students scored 12 or more? [1 mark]
- (d) Give the ratio of students scoring 12 or more to those scoring less than 12, in its simplest form. [1 mark]
- (e) The scores were grouped as 5 to 9, 10 to 14 and 15 to 19. Sketch a histogram of the ten scores. Give a suitable title and labels. [4 marks]
Model answer:
Part (c): four students scored 12 or more. That is 4 ÷ 10 × 100, or 40 per cent.
Part (d): four scored 12 or more and six scored less. The ratio is 4:6. Divide by 2 to get 2:3.
Part (e): four scores are in 5 to 9, five in 10 to 14 and one in 15 to 19.
Draw three touching bars at heights 4, 5 and 1. Label the axes “frequency” and “memory score”. Use a title such as “A histogram to show the memory scores of ten students”.
Practice Question 7: Correlation and a Scatter Diagram (5 marks)
Imagine a teacher records the mean hours of sleep and the mean test score for six classes. Classes that slept more had higher mean test scores.
- (a) Identify the type of correlation. [1 mark]
- (b) Give a suitable title and label both axes for a scatter diagram. [2 marks]
- (c) Explain one weakness of using a correlation here. [2 marks]
Model answer:
- (a) A positive correlation.
- (b) The title is “A scatter diagram to show the relationship between mean hours of sleep and mean test score”. Both axes include “mean”.
- (c) A correlation cannot show that sleep causes higher scores. A third factor could explain both.
Practice Question 8: Name the Method (4 marks)
Imagine a head teacher starts the school day later. A researcher takes every tenth name from the school register. She compares those students’ days of absence before and after.
Name four things. [4 marks]
- the research method
- the type of experiment
- the experimental design
- the sampling method
Model answer: The method is an experiment. The type is a natural experiment, because the school changed the start time, not the researcher. The design is repeated measures, because the same students are measured twice. The sampling method is systematic.
Practice Question 9: Laboratory Experiments (9 marks)
Imagine this question. Briefly outline laboratory experiments and field experiments. Then use one published experiment to discuss strengths and weaknesses. Choose one type. [9 marks]
Model answer: In a laboratory experiment, the researcher changes the independent variable in a controlled, artificial setting. In a field experiment, the researcher does this in an everyday setting, such as a school playground.
I will discuss laboratory experiments. One strength is standardised procedures. In Gilchrist and Nesberg’s study, every participant saw each food slide for 15 seconds. So everyone was tested in the same way, and the study is easy to repeat.
One weakness is low ecological validity. Participants judged pictures of food in a laboratory. They may judge real food in a restaurant differently. So the findings may not fit everyday life.
References
Bickman, L. (1974). The social power of a uniform. Journal of Applied Social Psychology, 4(1), 47–61. https://doi.org/10.1111/j.1559-1816.1974.tb02599.x
Bruner, J. S., & Minturn, A. L. (1955). Perceptual identification and perceptual organization. The Journal of General Psychology, 53(1), 21–28. https://doi.org/10.1080/00221309.1955.9710133
Gilchrist, J. C., & Nesberg, L. S. (1952). Need and perceptual change in need-related objects. Journal of Experimental Psychology, 44(6), 369–376. https://doi.org/10.1037/h0061823
Penfield, W. (1959). The interpretive cortex. Science, 129(3365), 1719–1725. https://doi.org/10.1126/science.129.3365.1719
Piliavin, I. M., Rodin, J., & Piliavin, J. A. (1969). Good Samaritanism: An underground phenomenon? Journal of Personality and Social Psychology, 13(4), 289–299. https://doi.org/10.1037/h0028433