Brodmann areas are distinct regions of the cerebral cortex defined by their specific cellular structure (cytoarchitecture) and organization. In neuropsychology and biological anthropology, these numbered areas are used to map functional regions of the brain, linking specific physical locations to cognitive behaviors such as speech, vision, and executive planning.
In 1909, Korbinian Brodmann divided the cerebral cortex into 52 distinct regions based on cytoarchitecture, the specific organization and types of cells found in the tissue.
These regions remain the “gold standard” in modern neuroimaging (like fMRI) and neurosurgery, allowing doctors and researchers to communicate using a shared coordinate system.
Brodmann areas help bridge the gap between gross anatomy (the physical lobes of the brain) and cognitive neuroscience (how we think, feel, and move).
Each area carries its own number, from BA1 to BA52.
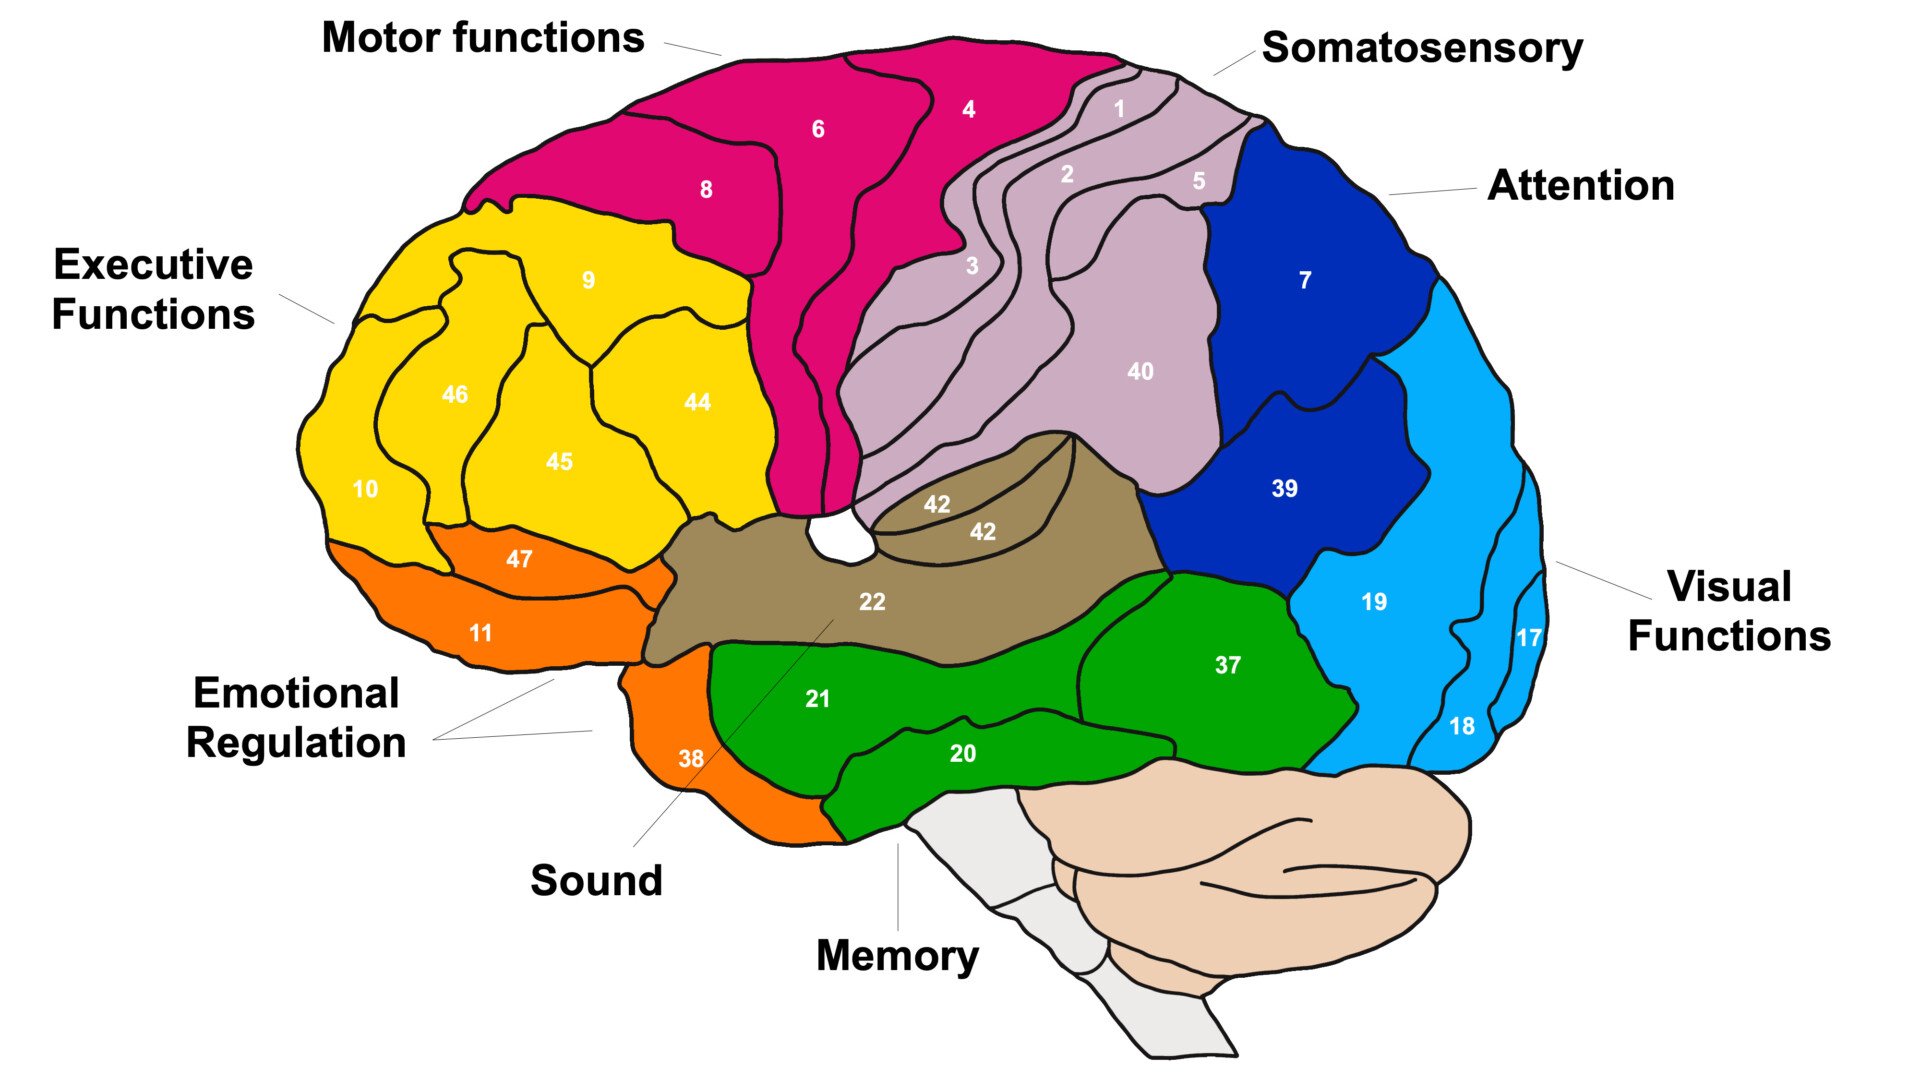
Key Takeaways
- 52 Regions: Korbinian Brodmann divided the cerebral cortex into 52 numbered areas in 1909, based on cytoarchitecture: the microscopic layering and cell types of the tissue.
- Not a Ranking: the numbers reflect the order Brodmann described each area, not its importance or its position in the brain – that’s why BA4 sits beside BA3 and BA6 while BA17 is far away at the back.
- Structure Predicts Function: areas that look different under the microscope usually do different jobs – BA4 is the primary motor cortex, BA17 is the primary visual cortex, BA44/45 form Broca’s area for speech.
- Shared Language: Brodmann numbers give researchers, radiologists, and surgeons a common way to name a piece of cortex, still used daily in brain imaging and neurosurgery.
- Refined, Not Replaced: a 2016 imaging study of 210 adults recovered much of Brodmann’s map from living-brain data while also subdividing it into about 180 areas per hemisphere.
- Not Perfect: the exact size and location of an area varies from person to person, and Brodmann’s century-old boundaries were drawn by eye from relatively few brains.
Key Brodmann Areas and Their Functions
Areas 1, 2, and 3 – Processing Touch and Sensation
Brodmann areas 1, 2, and 3 make up the primary somatosensory cortex. This is your brain’s touch center.
This part of the brain is located in the postcentral gyrus, which sits in the parietal lobe, and it’s where your brain processes sensory information coming from your body.
These three areas work together as a team, processing sensory signals from the thalamus – a relay station for information coming from your skin, muscles, and joints.
The primary somatosensory cortex helps you feel touch and temperature. It also processes pain.
It also tells you where your body parts are without looking – that’s called proprioception.
It also plays an important role in fine motor control and motor learning by helping coordinate movement based on sensory input.
How are the two areas connected?
The primary somatosensory cortex helps your brain keep track of where your body parts are during movement. It then sends feedback to the motor areas. This keeps your movements smooth and coordinated.
This sensory area sits right next to the primary motor cortex, just on the other side of the central sulcus.
Together, they form a team called the sensorimotor cortex, working closely to help you both sense and move your body effectively.
Area 4 – Controlling Movement
Brodmann Area 4 is a part of the brain called the primary motor cortex.
It sits in the frontal lobe and is important because it controls the movements you make on purpose, like picking up a cup or walking.
This area helps start and organize your voluntary movements. It makes sure your muscles work together smoothly when you do things like waving your hand or smiling.
It also helps plan and sequence movements in the right order, so your actions are coordinated and fluid – whether you’re tying your shoes or playing an instrument.
Giant Betz cells here drive that movement.
Brodmann Area 4 controls movement on the opposite side of your body. That means the left side of your brain moves the right side of your body, and the right side moves the left.
For example, to move your left leg, the right hemisphere’s motor cortex is activated.
Area 9 – Thinking, Planning, and Decision-Making
Brodmann Area 9 is part of the dorsolateral prefrontal cortex, which sits in the frontal lobe of your brain. It mainly covers parts of the middle and superior frontal gyri.
Area 46 sits right next to it. Together, the two make up the DLPFC.
This area is really important for higher-level thinking – things like working memory, paying attention, making decisions, solving problems, and managing overall executive control.
It also plays a big role in regulating emotions, guiding social behavior, and helping with self-awareness—all key jobs of the prefrontal cortex.
Depression treatment often targets this area with brain stimulation.
Because it’s so involved in thinking and feeling, researchers often study Area 9 when looking at mental health issues like depression, schizophrenia, and ADHD.
It’s a major focus in studies of neuropsychiatric disorders and brain imaging.
Area 9 connects with many other parts of the brain, helping bring together different kinds of information so you can think clearly and make good decisions.
Area 17 – Seeing and Interpreting Visual Information
Brodmann Area 17, also called the primary visual cortex or V1, is located in the occipital lobe at the back of the brain.
It’s the very first part of the visual cortex where the brain begins to process what your eyes see.
This area handles the initial visual information coming from your eyes, detecting simple features like edges, shapes, and movement.
This is the brain’s first stop for vision.
It plays a crucial role in helping you make sense of the visual world.
You’ll find Brodmann Area 17 along the calcarine fissure, a groove in the cerebral cortex of the occipital lobe.
It’s often called the striate cortex because of a distinctive stripe called the line of Gennari. This stripe lies in layer IV. Many nerve fibers from the thalamus arrive there.
Inside this area, there’s a detailed map of the visual field. Every point you see corresponds to a specific spot in the cortex. Scientists call this retinotopic mapping.
Brodmann Area 17 processes key visual features like line orientation, where things are in space, and movement.
It also helps combine information from both eyes. This creates a unified image and depth perception – a process called binocular integration.
Once Brodmann Area 17 finishes its initial processing, it sends the information to nearby areas like visual area V2 and V3.
These areas handle more complex aspects of vision like color, shape, and motion.
Area 21 – Understanding Language and Meaning
Brodmann Area 21 sits in the middle temporal gyrus, part of the temporal lobe. It helps process language and memory.
This area helps us understand both verbal and non-verbal communication by processing sounds and meanings, supporting auditory processing, language comprehension, semantic memory, and speech processing.
It also helps interpret social cues like tone of voice and facial expressions, which are key for effective communication.
Area 21 works closely with other language regions. That includes Wernicke’s area in Brodmann Area 22, which is essential for understanding language.
When this area is damaged or not working properly, it can lead to language difficulties like aphasia.
It’s also involved in conditions such as Alzheimer’s disease and other neurodegenerative disorders that affect language and memory.
Area 22 – Comprehending Speech and Social Cues
Brodmann Area 22 sits in the superior temporal gyrus of the cerebral cortex. It’s mainly found in the left hemisphere.
It plays a major role in auditory processing, language comprehension, and speech perception.
A specific part of this area, called Wernicke’s area, is found in the posterior superior temporal gyrus of the left hemisphere.
It is one of the brain’s key language centers, crucial for understanding language, processing meaning (semantic processing), and interpreting speech.
Damage to Wernicke’s area can cause Wernicke’s aphasia. This leads to language impairment and difficulties comprehending speech.
In most people, the left hemisphere is dominant for language due to brain lateralization and language dominance.
Brodmann Area 22 connects with Broca’s area and other parts of the language network, supporting speech production.
In the right hemisphere, Brodmann Area 22 processes the melodic and tonal aspects of speech – its rhythm and intonation, known as prosody. Prosody carries speech’s emotional tone.
Areas 23, 24, 28, and 33 – Emotions and Memory
Brodmann areas 23, 24, and 28 are all part of the limbic system. This system plays a big role in emotion and memory.
Areas 23 and 24 belong to the cingulate cortex – Area 23 is in the posterior cingulate gyrus, while Area 24 is in the anterior cingulate gyrus.
Brodmann Area 28 is located in the entorhinal cortex, deep in the medial temporal lobe.
These areas help regulate emotions, respond to pain, and form emotional memories.
Area 23 processes emotions and pain. It also helps create emotional memories and supports social communication.
It also plays a part in learning from emotional feedback and avoiding negative experiences.
Area 24 focuses on regulating emotions, motivation, detecting errors, and controlling automatic body functions like heart rate.
Area 28 is essential for forming memories and processing smells, thanks to its location in the entorhinal cortex of the medial temporal lobe.
Area 33 sits beside Area 24 in the cingulate cortex. It shares that same role in emotion regulation and the effortful control of attention.
All four areas connect closely through neural pathways.
Together, Brodmann areas 23, 24, 28, and 33 support emotional processing, memory, and attention within the limbic system.
Areas 44 and 45 – Producing Language
Broca’s area sits in the inferior frontal gyrus (IFG) of the frontal lobe. It has two parts.
These are the pars opercularis (Brodmann Area 44) and the pars triangularis (Brodmann Area 45). Together, they coordinate motor planning. This lets you produce speech and write.
This area plays a big role in language processing – helping you structure sentences, choose the right words, and manage the rhythm and grammar of what you say.
Area 44 mainly handles the motor side of speech, controlling how your face, tongue, and larynx move during talking.
Area 45 focuses on understanding meaning and grammar. It also plans speech movements.
Broca’s area helps you formulate speech, organize sentences, and process grammar, making sure your language flows smoothly.
If Broca’s area gets damaged, it can cause non-fluent aphasia, where people struggle with grammar (agrammatism), have unusual speech rhythm (dysprosody), and face other speech production difficulties.
Interestingly, a reduction in gray matter volume in Area 45 has also been linked to psychotic symptoms seen in schizophrenia.
Brodmann Areas by Location and Function
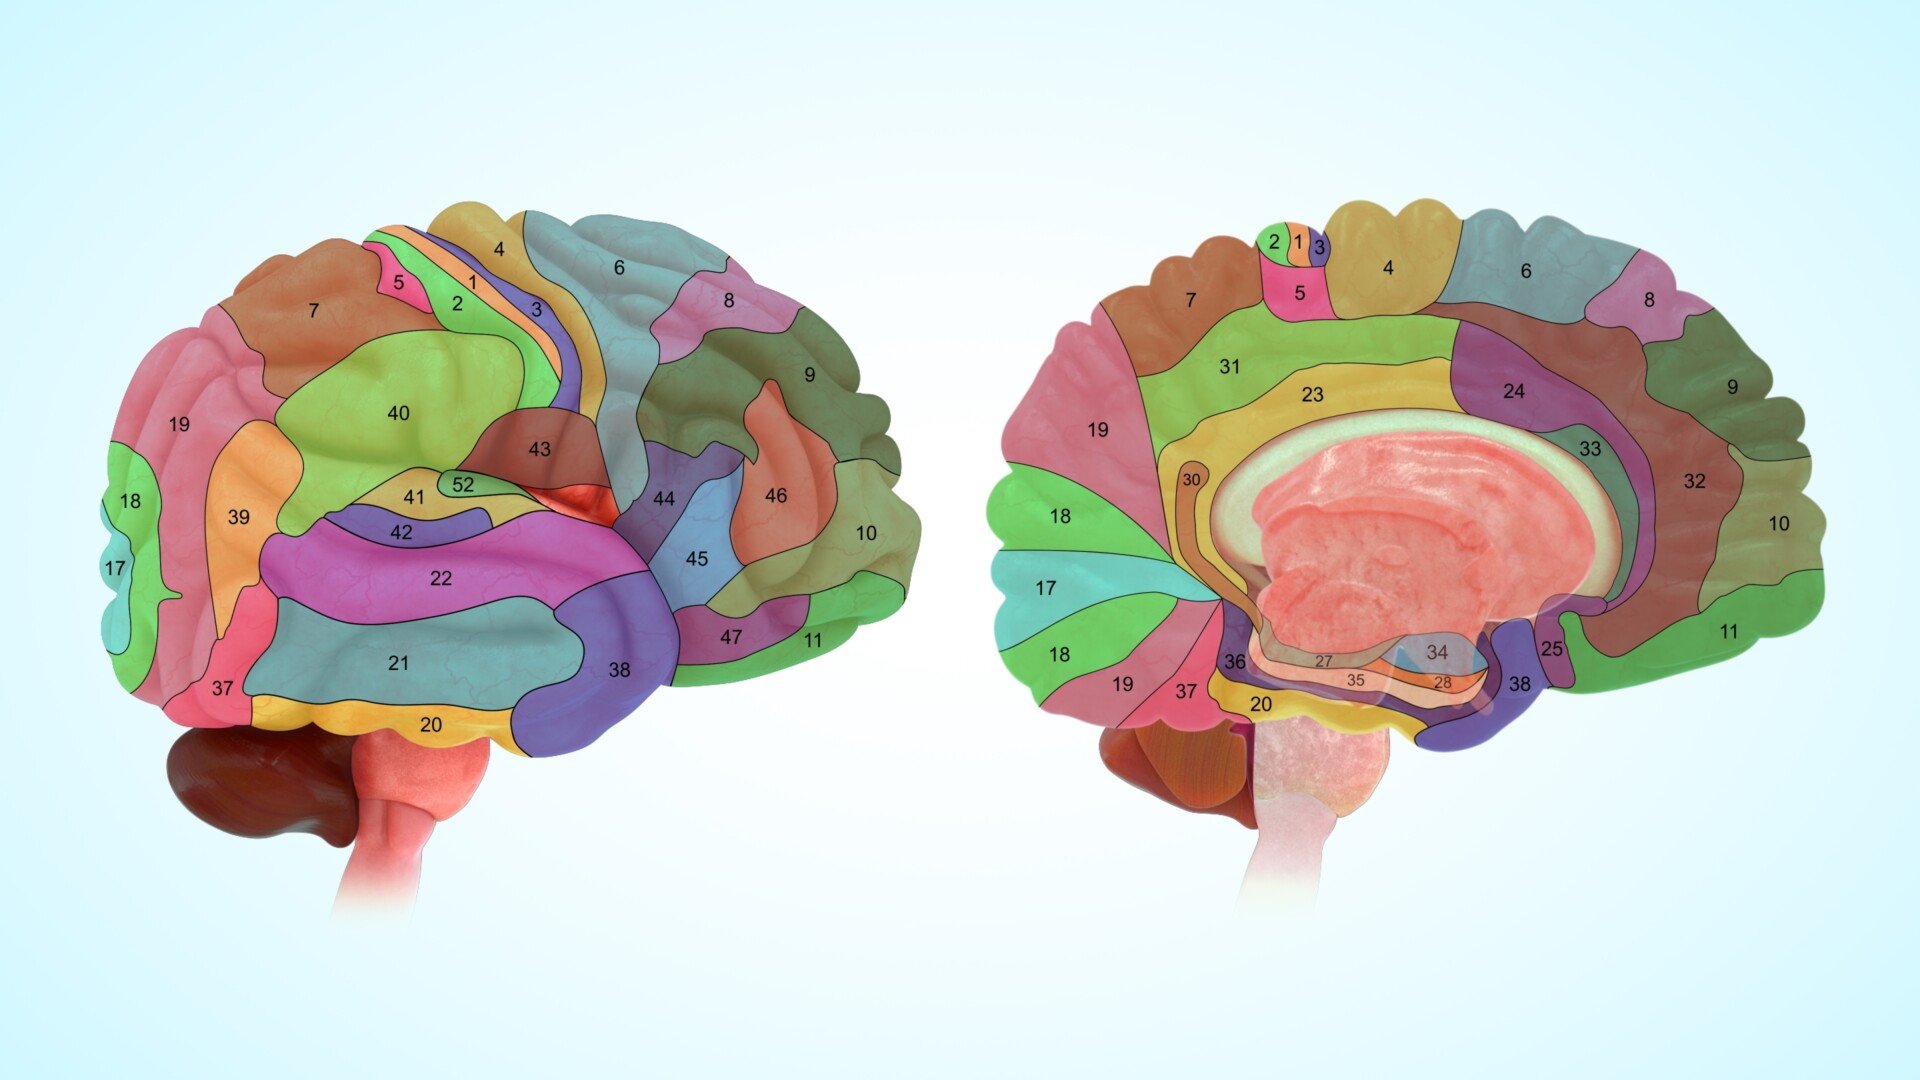
Below is a breakdown of where all of Brodmann areas are located:
Frontal Lobe Areas
- Area 4 – Primary Motor Cortex
Controls voluntary movements for specific body parts. - Area 6 – Premotor and Supplementary Motor Cortex
Involved in planning and coordinating movements. - Area 8 – Frontal Eye Fields
Regulates voluntary eye movements and visual attention. - Areas 9, 10, 11, 12, 46, 47 – Prefrontal Cortex
Supports working memory, decision-making, attention, emotion regulation, and task planning. - Areas 44 & 45 – Broca’s Area
Essential for speech production and language structure.
Parietal Lobe Areas
- Areas 1, 2, 3 – Primary Somatosensory Cortex
Processes touch, pain, temperature, and body position. - Areas 5 & 7 – Somatosensory Association Cortex
Integrates sensory input for perception and spatial awareness. - Area 39 – Angular Gyrus
Involved in reading, number processing, memory, and attention. - Area 40 – Supramarginal Gyrus
Supports phonological processing and emotional interpretation.
Temporal Lobe Areas
- Areas 20, 21, 22 – Inferior, Middle, and Superior Temporal Gyri
Process sound, language, semantic memory, and social communication. Wernicke’s area is found in Area 22. - Area 38 – Temporal Pole
Linked to face recognition, emotion, and high-level visual memory. - Areas 41 & 42 – Primary Auditory Cortex
First cortical relay for hearing, organized tonotopically so that sound frequency is mapped systematically across the surface.
Occipital Lobe Areas
- Area 17 – Primary Visual Cortex (V1)
Processes basic visual input like light, shape, and movement. - Area 18 – Secondary Visual Cortex (V2)
Refines visual information from V1. - Area 19 – Associative Visual Cortex (V3–V5)
Enables higher-level visual tasks like motion detection and object recognition.
Limbic and Related Areas
- Areas 23, 24, 28–33 – Cingulate Gyrus
Regulates emotion, pain, attention, and memory. - Area 25 – Subgenual Area
Linked to mood regulation and rich in serotonin transporters. It’s a target for deep-brain stimulation in treatment-resistant depression. - Area 26 – Retrosplenial Motor Region
Involved in motor learning. - Area 27 – Piriform Cortex
Associated with the sense of smell. - Area 29–31 – Retrosplenial and Posterior Cingulate Cortex
Involved in memory, navigation, and the brain’s default mode network. - Areas 34–36 – Entorhinal and Perirhinal Cortex
Crucial for working memory and memory consolidation. - Area 37 – Fusiform Gyrus
Plays a role in facial recognition and complex visual processing. - Area 48 – Retrosubicular Area
Supports emotional processing and spatial orientation. - Area 52 – Parainsular Area
Important for attention and detecting salient stimuli.
Brodmann Areas Map
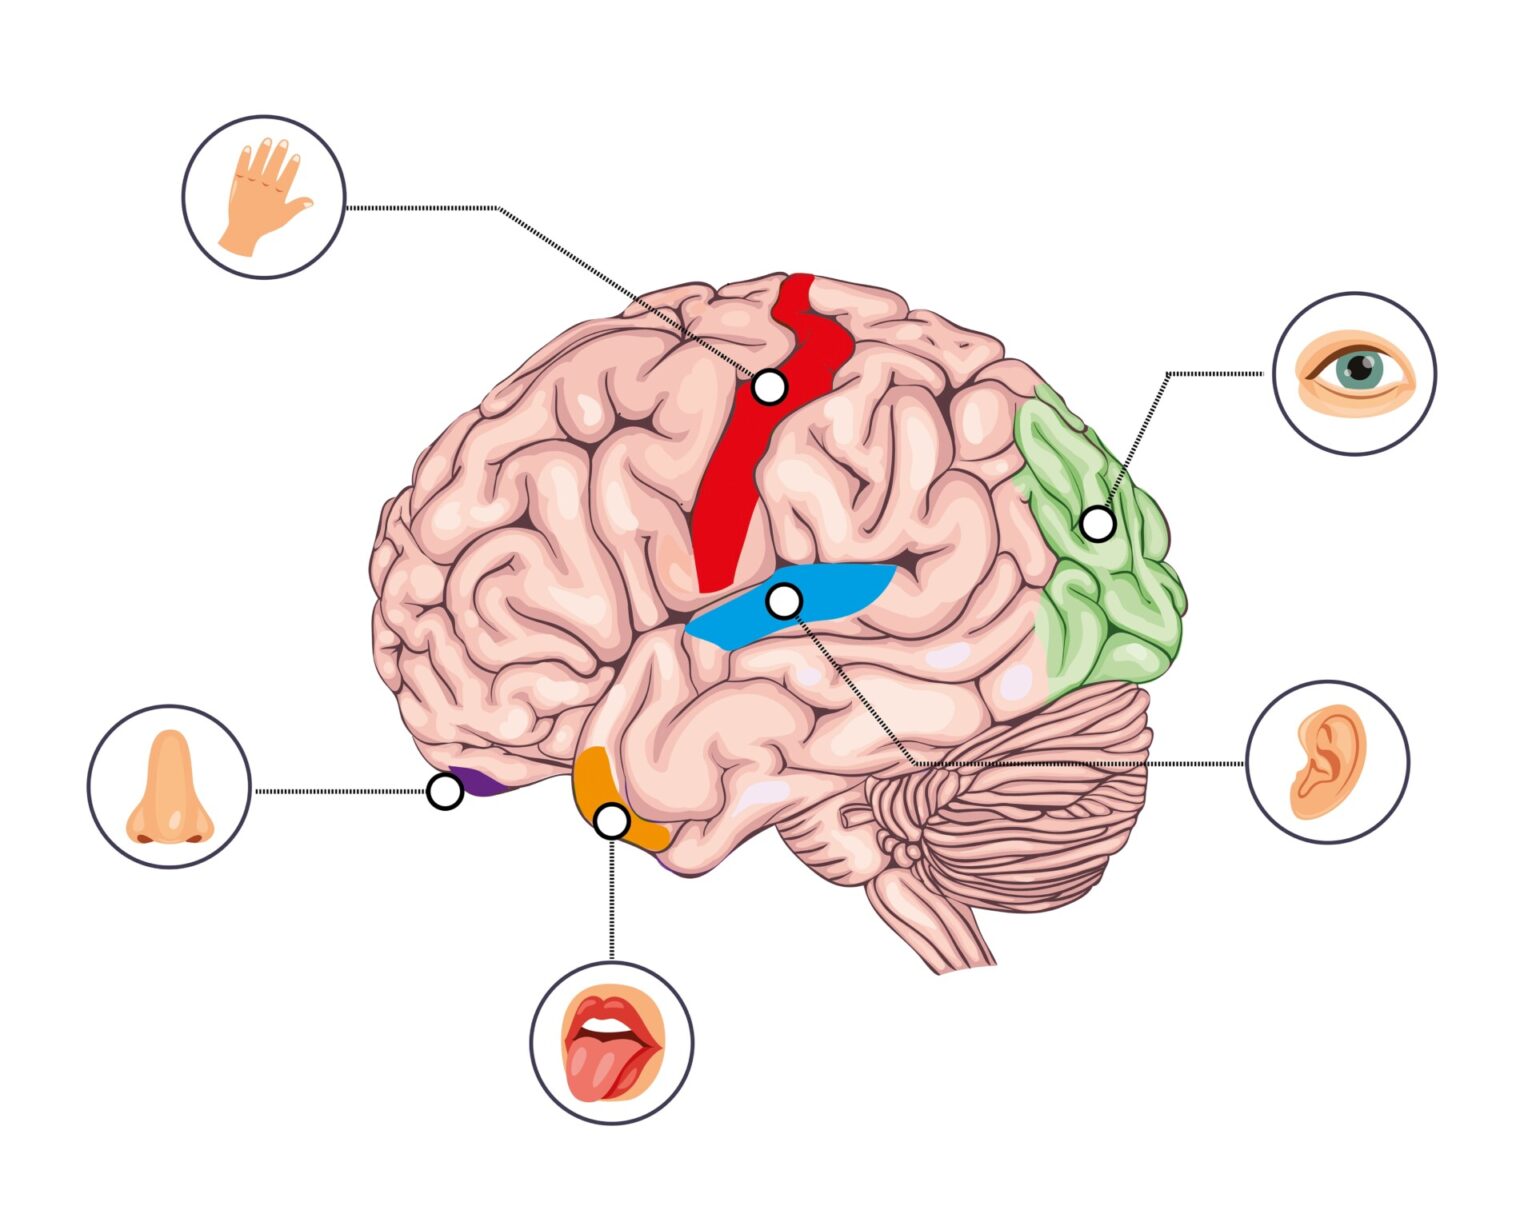
Brodmann Areas List

Cytoarchitecture: How the Map Was Built
Brodmann’s numbers come from cytoarchitecture: the microscopic arrangement of neurons in a patch of cortex. Staining thin tissue slices makes the cell bodies visible under a microscope, revealing that a slice through the cortex isn’t uniform.
That pattern isn’t random.
The cells sit in horizontal bands, or laminae, and the thickness, density, and type of cell in each band is what defines a Brodmann area.
Across most of the human cortex, this banding resolves into six layers. They run from the outer, pial surface inward to the white matter, and are conventionally numbered I to VI.
The Six Layers of the Cortex
Here is what distinguishes each layer under the microscope:
- Layer I, the molecular layer: a cell-sparse outer layer made mostly of branching nerve fibers, with very few cell bodies of its own.
- Layer II, the external granular layer: a dense band of small, round cells and small pyramidal cells.
- Layer III, the external pyramidal layer: medium-to-large pyramidal cells whose fibers link one cortical area to another.
- Layer IV, the internal granular layer: the main input layer, packed with small cells that receive incoming sensory signals from the thalamus.
- Layer V, the internal pyramidal layer: large pyramidal cells that carry the cortex’s main output to lower brain structures.
- Layer VI, the multiform layer: a mixed layer that projects back to the thalamus, closing the loop.
Granular vs. Agranular Cortex
These six layers aren’t the same everywhere. That difference is what actually separates one Brodmann area from another.
In sensory cortex, layer IV is thick and densely packed, giving the tissue a grainy look under the microscope known as koniocortex. Brodmann Area 17, the primary visual cortex, is so distinctly layered that its input layer forms a pale stripe visible to the naked eye.
Motor cortex is the opposite. Layer IV almost disappears there.
Instead, giant output cells called Betz cells dominate layer V and drive voluntary movement through the corticospinal tract. This agranular pattern is what makes Brodmann Area 4 recognizable under the microscope, long before anyone tests what it does.
Cutting across these horizontal layers is a second, vertical organization. Neurons are also grouped into narrow columns running from the surface down to the white matter.
Cells within one column tend to share a job, such as responding to the same patch of skin.
The Origins of Brodmann’s Map
Korbinian Brodmann was a German neurologist who transformed how we understand the brain’s structure.
In 1909, he published a detailed map of the cerebral cortex based on its cytoarchitecture: the arrangement, density, and cell types found in each patch of tissue.
Brodmann’s 1909 Study
Aim: To find out whether the cerebral cortex is a uniform sheet or a patchwork of distinct regions, by comparing its microscopic cell structure at different points and across species.
Method: Using a cell-staining technique, Brodmann examined thin slices of cortex under the microscope point by point, in humans and many other mammals.
He recorded the number, thickness, density, and cell types of the layers at each spot, marking a new boundary wherever this pattern changed.
Results: The cortex was not uniform. It resolved into just over 50 distinct areas, each with its own repeatable cell-layer pattern, and the same basic six-layer structure turned up across species with systematic variations.
Conclusion: The cortex is a patchwork of structurally distinct areas, and Brodmann argued these architectural boundaries also mark boundaries in function.
Decades of research proved him right. The strip he marked as area 4 on cell structure alone turned out to be exactly the strip that produces movement when electrically stimulated (Penfield & Rasmussen, 1950).
Why the Numbers Don’t Run in Order
Brodmann built his map by working systematically across the whole cortex. He numbered each area in the order he described it, not by its location.
That’s why the numbers jump around the brain.
Area 4 sits right next to areas 3 and 6. Area 17, though, is tucked at the very back of the brain, and area 25 sits deep beneath its front.
The order simply records the sequence in which Brodmann examined the tissue. It carries no significance beyond that. A low number isn’t more important than a high one, and neighboring numbers aren’t necessarily neighbouring brain regions.
That numbering habit explains areas 44 and 45 too. These are the two language regions inside Broca’s area, and Brodmann simply happened to describe them one after another.
Why Are Brodmann Areas Still Relevant Today?
Even though Korbinian Brodmann mapped the brain over a century ago, his work remains a cornerstone of modern neuroscience and psychology.
Why? Brodmann areas offer a consistent, structured way to describe the brain’s surface – and link its anatomy to function.
These numbered regions are still used in research, brain imaging (like fMRI), and clinical practice to locate and describe specific parts of the cortex.
They also guide treatment. Doctors deliver therapeutic transcranial magnetic stimulation for depression to Area 9/46, and target deep-brain stimulation for treatment-resistant depression at the subgenual cingulate, Area 25.
The same numbers guide surgery. Neurosurgeons operating for epilepsy or tumors must spare “eloquent” cortex – the motor strip (Area 4) and the language areas (Areas 44, 45, 22). Brodmann’s scheme gives the shared framework for identifying that territory.
The site of damage predicts the deficit. Damage to Area 4 impairs voluntary movement on the opposite side of the body, and damage to Areas 44/45 produces non-fluent aphasia. Damage to Area 22 causes Wernicke’s aphasia, and damage to Area 17 causes blindness in part of the visual field.
The uses go beyond the clinic too.
For example, neuroscientists studying memory activation may refer to Brodmann area 37, while a neurologist investigating speech loss might focus on areas 44 and 45.
While some areas have been subdivided or refined with newer imaging technologies, Brodmann’s map is still one of the most practical and widely recognized systems for understanding the brain.
Why Are Brodmann Areas Still Relevant Despite Advances in Imaging Technologies?
Even though modern brain imaging techniques like fMRI and PET let us see brain activity in real time, scientists still need reliable landmarks to make sense of what they’re seeing.
That’s where Brodmann areas come in.
They act like a standardized map of the brain’s surface, helping researchers and doctors pinpoint exactly which part of the brain is doing what.
On top of that, while imaging shows which areas light up during tasks, Brodmann’s work explains why those areas handle certain functions by looking at the brain’s detailed cellular structure.
This link between how the brain is built and what it does is still really important, especially when planning brain surgery or diagnosing neurological problems.
Critical Evaluation
Brodmann’s map is one of the most useful tools in neuroscience, but it is not beyond criticism. Here are the main limitations researchers raise:
- Too Simple a Picture: a Brodmann number seems to name one job, but real cortical areas work as multi-functional nodes inside distributed networks, not standalone modules.
- Person-to-Person Variation: the exact size and location of an area differs between people, so a label placed by eye can be off by a centimetre or more.
- Approximate, Revised Borders: Brodmann drew his boundaries by eye from a small number of brains, and rival maps divide the cortex differently.
- Structure Doesn’t Always Match Function: a boundary in cell architecture doesn’t always line up with a boundary in what the tissue does.
- Relying on a Century-Old Map: modern papers still use labels drawn from a handful of stained brains in 1909, which can suggest more precision than the map really offers.
Too Simple a Picture
The convenience of the Brodmann system is that one number seems to name one place, and one job. That encourages a modular picture of the cortex. In reality, most Brodmann areas are multi-functional and work as nodes inside distributed brain networks, not as self-contained units.
Language is a good example. It doesn’t come from Broca’s area alone, but depends on Broca’s and Wernicke’s areas working together through the white-matter tracts that connect them.
The dorsolateral prefrontal cortex (BA9/46) is another case. It takes part in working memory, attention, decision-making, and emotion regulation all at once, not just one of them.
Reading a function straight off a Brodmann number risks mistaking one necessary piece of a network for the whole mechanism behind a behavior.
Person-to-Person Variation
Brodmann drew a single, schematic map. But the exact location, size, and even the presence of a given area varies substantially from one person to the next. The areas also don’t sit at fixed positions relative to the brain’s visible folds.
That variation matters.
A Brodmann label assigned by eye, or one fitted onto a standard template, can be off by a centimetre or more. This is a real problem when that label is used to interpret a brain scan or plan surgery.
Modern probabilistic atlases were built to address this directly. The Julich-Brain atlas maps each area as a three-dimensional probability cloud built from many brains, rather than drawing a single fixed border. This captures the person-to-person variation Brodmann’s original drawing could not (Amunts et al., 2020).
Approximate, Revised Borders
Brodmann worked from a limited number of brains. He drew his boundaries by eye from stained tissue sections, and left some regions only coarsely divided.
Other researchers redrew the map soon after. Von Economo and Koskinas (1925) published a rival cytoarchitectonic atlas that is, in places, more finely divided than Brodmann’s, and whose areas don’t line up one-to-one with his numbers.
There is, in short, no single “true” number of cortical areas. The count depends on the criterion used and the researcher doing the counting, and Brodmann’s 52 areas are one defensible parcellation among several that have been proposed since.
That doesn’t make Brodmann’s map wrong. It makes it one snapshot of a continuing project, not a finished inventory of the cortex.
Structure Doesn’t Always Match Function
Brodmann’s founding assumption is that a boundary in cell architecture marks a boundary in function. That holds often, but not always. Some of his cytoarchitectonic areas actually contain more than one functional subdivision.
Some functionally distinct areas also straddle one of his architectural borders instead of sitting neatly inside it. The link between microscopic structure and the connectivity-based or task-based areas mapped by modern imaging is only partial.
A 2016 study tested this directly. It required cortical architecture, function, and connectivity to all change together at the same boundary before drawing a new area.
The result agreed with Brodmann’s map in many places, and departed from it in others (Glasser et al., 2016). That partial overlap means a Brodmann number is a useful clue to function, not a guarantee of it.
Relying on a Century-Old Map
Perhaps the sharpest criticism is less about the science and more about habit. Neuroscience keeps reporting results using a scheme drawn from a handful of stained brains in 1909. That’s long after better, quantitative, in-vivo maps became available.
That habit runs deep.
Labeling a brain region “BA46” imports all of Brodmann’s original approximations: his eyeballed borders, his small sample, his single template. That gets carried into a modern paper. It can create a false impression of precision the number doesn’t actually have.
Old habits are hard to break. The scheme’s staying power owes as much to convention and convenience as to its being the best available description of any one person’s brain.
Even so, no rival system has replaced it as the field’s common shorthand. Brodmann’s numbers, in other words, persist by habit as much as by merit.
Contemporary Research
Modern brain imaging has moved from Brodmann’s stained tissue slices to non-invasive maps of the living cortex. The picture that’s emerged largely confirms Brodmann’s founding idea, while replacing his specific 1909 boundaries with a far more detailed atlas.
The overall shift is a move from cytoarchitecture alone to multi-property parcellation. The result is a sharper map. Newer maps combine structure with function and connectivity, building the precise coordinate system Brodmann’s method could only approximate.
A New Map of the Living Cortex (Glasser et al., 2016)
Aim: To produce a precise, reproducible map of the living human cerebral cortex, and to test how closely it matches Brodmann’s century-old cytoarchitectonic map.
Method: Researchers scanned 210 healthy adults with multi-modal MRI, measuring cortical architecture, task activity, resting-state connectivity, and visual-field mapping at every point on the cortex.
A boundary was drawn wherever several of these measures changed sharply together, then tested on an independent group of 210 more adults.
Results: Each hemisphere divided into 180 distinct areas. That’s 360 in total, and 83 of them matched areas already known from microscopy work like Brodmann’s, while 97 were newly identified subdivisions his coarser map had missed.
Conclusion: Brodmann’s founding insight – that the cortex is a mosaic of distinct areas – held up under modern, living-brain data. His specific 1909 map was refined into a much finer one (Glasser et al., 2016).
Mapping Individual Variation: The Julich-Brain Atlas
The Julich-Brain atlas addresses a different weakness in the classical map: no two brains are exactly alike.
Rather than drawing one fixed border per area, it maps each region as a probability distribution built from many post-mortem brains. It then registers each map into the coordinate space used by brain-imaging studies (Amunts et al., 2020).
This directly answers the variability criticism above. Instead of assuming every brain matches Brodmann’s original drawing, each area becomes a cloud of likely locations.
A separate line of work, connectivity-based parcellation, divides the cortex by its wiring rather than its cell architecture. It finds broad agreement with both the classical and multi-modal maps.
Together, these approaches point to the same conclusion. Brodmann was right that the cortex is a parcellated mosaic, even though his own boundaries needed a century of refinement to become fully precise.
References
Amunts, K., Mohlberg, H., Bludau, S., & Zilles, K. (2020). Julich-Brain: A 3D probabilistic atlas of the human brain’s cytoarchitecture. Science, 369(6506), 988–992. https://doi.org/10.1126/science.abb4588
Brodmann K. 1909. Vergleichende Lokalisationslehre der Grosshirnrinde in ihren Prinzipien dargestellt auf Grund des Zellenbaues. Leipzig: J.A. Barth
Brodmann, K. (2006). Brodmann’s localisation in the cerebral cortex: the principles of comparative localisation in the cerebral cortex based on cytoarchitectonics. Boston, MA: Springer US.
Carter, R. (2019). The Human Brain Book: An Illustrated Guide to its Structure, Function, and Disorders (3rd ed). DK.
Ferng, A. (2021, May 31). Brodmann areas. Kenhub. https://www.kenhub.com/en/library/anatomy/brodmann-areas
Glasser, M. F., Coalson, T. S., Robinson, E. C., Hacker, C. D., Harwell, J., Yacoub, E., Ugurbil, K., Andersson, J., Beckmann, C. F., Jenkinson, M., Smith, S. M., & Van Essen, D. C. (2016). A multi-modal parcellation of human cerebral cortex. Nature, 536(7615), 171–178. https://doi.org/10.1038/nature18933
Hacking, C. Gaillard et al., (n.d.). Brodmann areas. Radiopaedia. Retrieved August 6, 2021, from: https://radiopaedia.org/articles/brodmann-areas?
Penfield, W., & Rasmussen, T. (1950). The cerebral cortex of man: A clinical study of localization of function. Macmillan.
Strotzer, M. (2009). One century of brain mapping using Brodmann areas. Clinical Neuroradiology, 19(3), 179-186.
von Economo, C., & Koskinas, G. N. (1925). Die Cytoarchitektonik der Hirnrinde des erwachsenen Menschen. Springer.
Further Reading
- Šimic, G., & Hof, P. R. (2015). In search of the definitive Brodmann’s map of cortical areas in human. Journal of Comparative Neurology, 523(1), 5-14.
- Judaš, M., Cepanec, M., & Sedmak, G. (2012). Brodmann’s map of the human cerebral cortex—or Brodmann’s maps?. Translational Neuroscience, 3(1), 67-74.